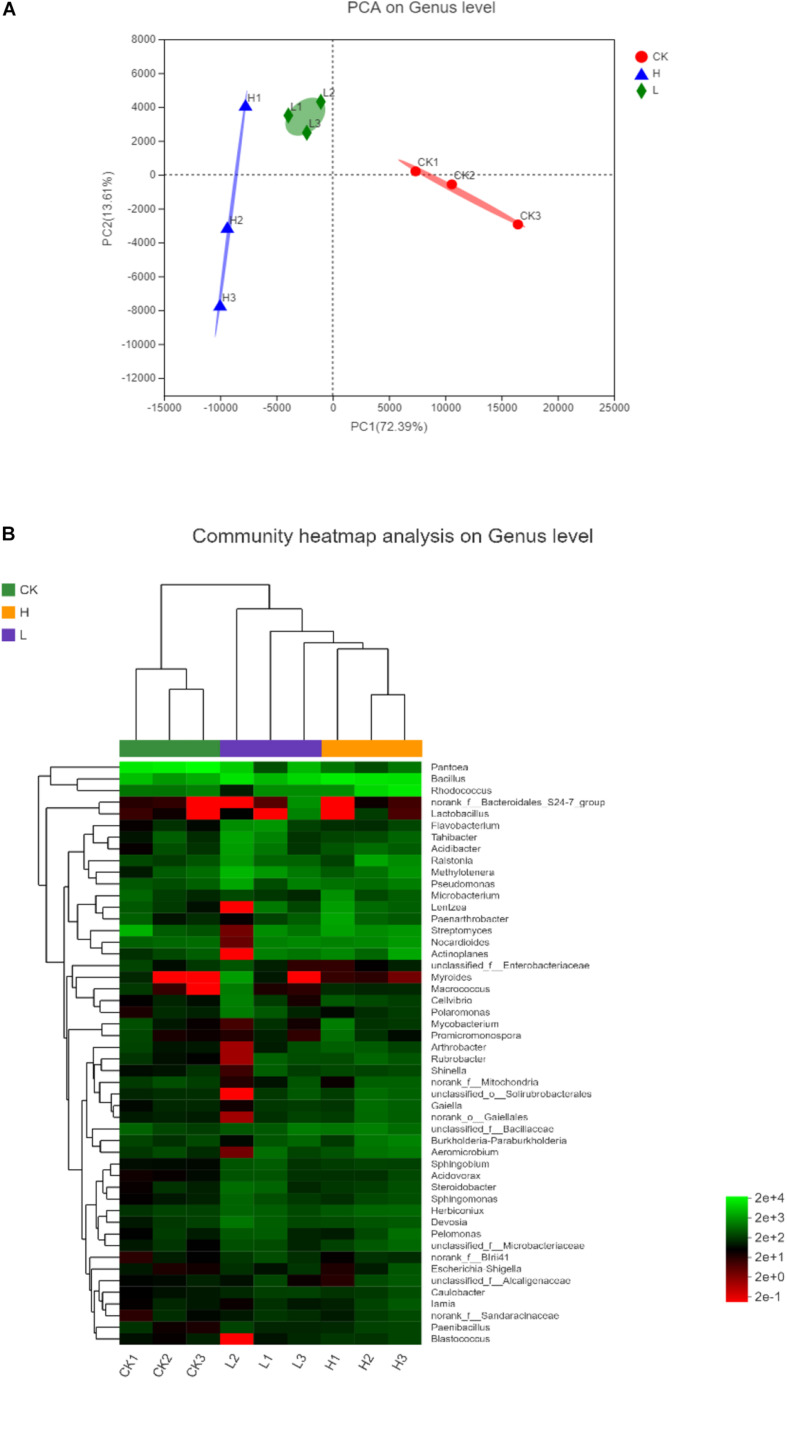
FIGURE 9.
The differences among the samples in different samples on genus level. (A) Principal Component Analysis (PCA) illustrates differences between bacterial communities in the three groups. (B) Heatmap of the top 50 most abundant genera in bacterial communities detected in the three groups. Dendrograms for hierarchical cluster analysis grouping genera and sample locations were shown at the left and at the top, respectively. (Group CK: the unpeeled potato tubers were treated with blank medium, the content of solanine was 273 mg/kg; Group L: the unpeeled potato tubers were treated with the active ingredient 40–20, the content of solanine was 163 mg/kg; and Group H: the unpeeled potato tubers were treated with the active ingredient 20–30, the content of solanine was 344 mg/kg).

