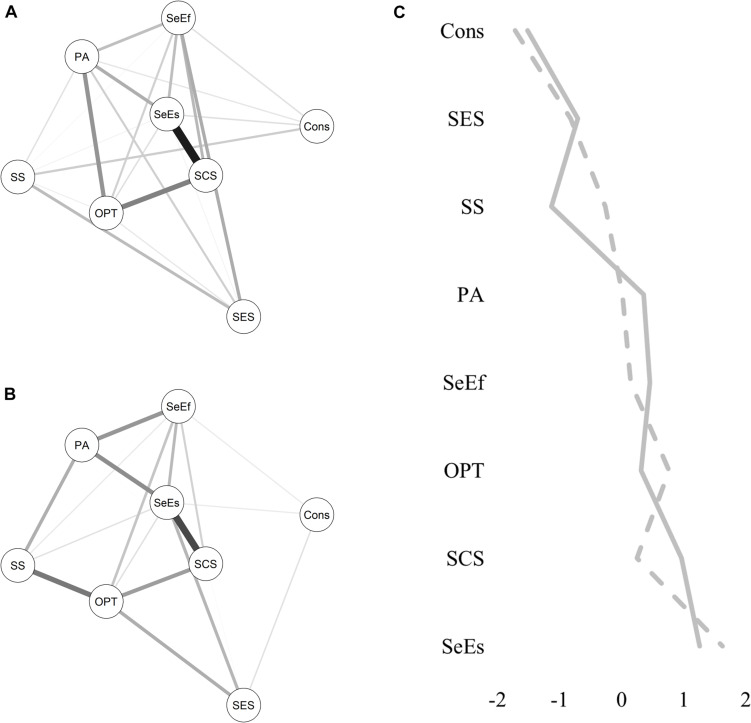
FIGURE 2.
Group-specific resource networks. (A) Control group network. (B) Risk group network. Solid lines indicate positive relationships. The wider the line, the stronger the relationship. SES, subjective socio-economic status; Cons, conscientiousness; PA, positive affect; OPT, optimism; SS, social support; SeEs, self-esteem; SeEf, self-efficacy; SCS, self-compassion. (C) Standardized resource strength centrality: solid line indicates control group, dashed line indicates risk group. The higher and more positive the value, the higher the strength centrality of a resource.

