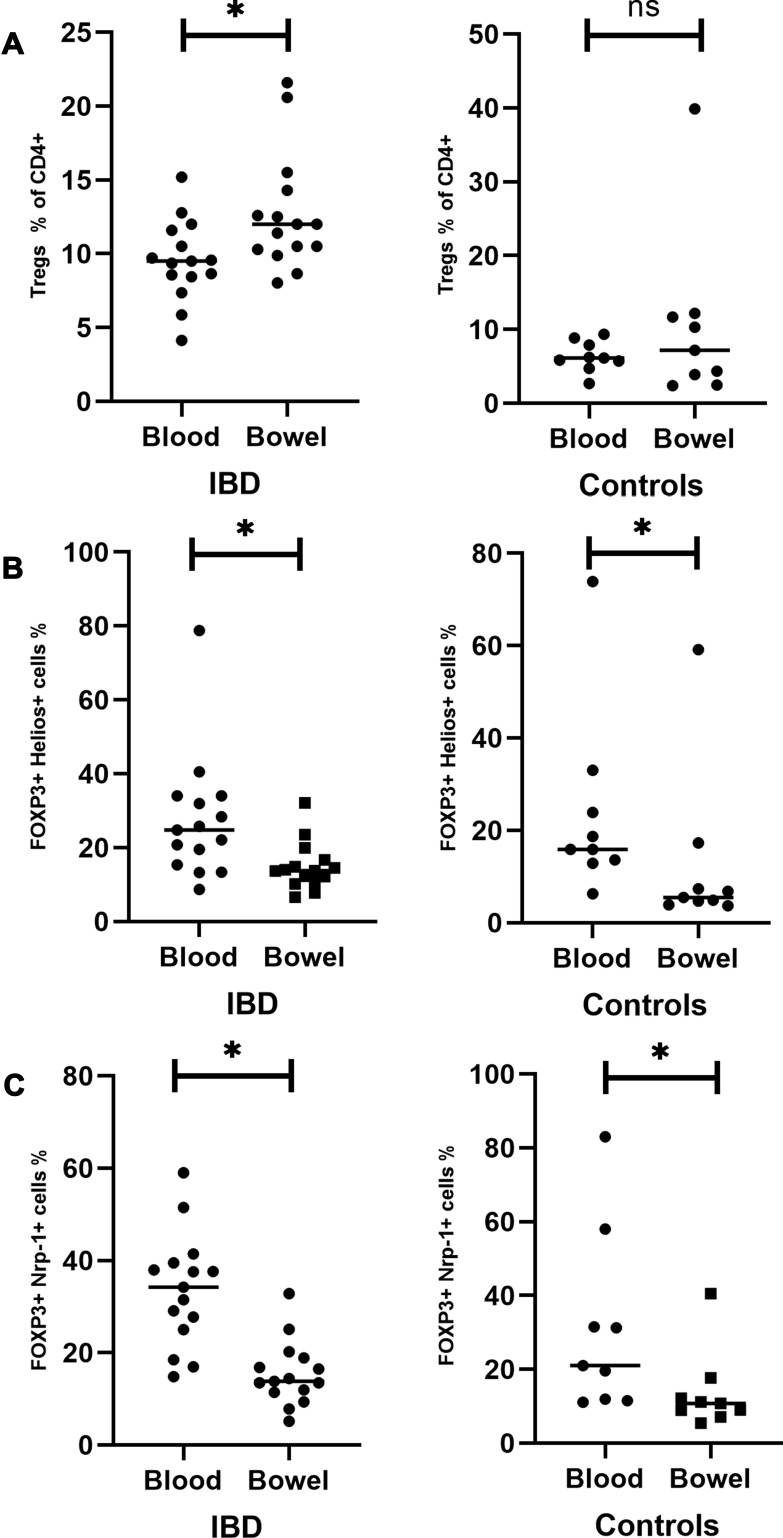
Figure 3.
Comparison of circulating and intestinal Tregs in the studied group (left panel) and the control group (right panel). (A) Circulating and intestinal Tregs expressed as a percentage of CD4+ lymphocytes in the IBD group (left side) and the controls (right side). (B) Circulating and intestinal Helios+ Tregs expressed as a percentage of all Tregs in the IBD group (left side) and the controls (right side). (C) Circulating and intestinal Nrp-1+ Tregs expressed as a percentage of all Tregs in the IBD group (left side) and the controls (right side). *Statistically significant difference. Individual results are shown as dots (●)/squares (■). Horizontal lines indicate median values.
Abbreviations: IBD, patients with inflammatory bowel disease; C, control group; ns, not significant.

