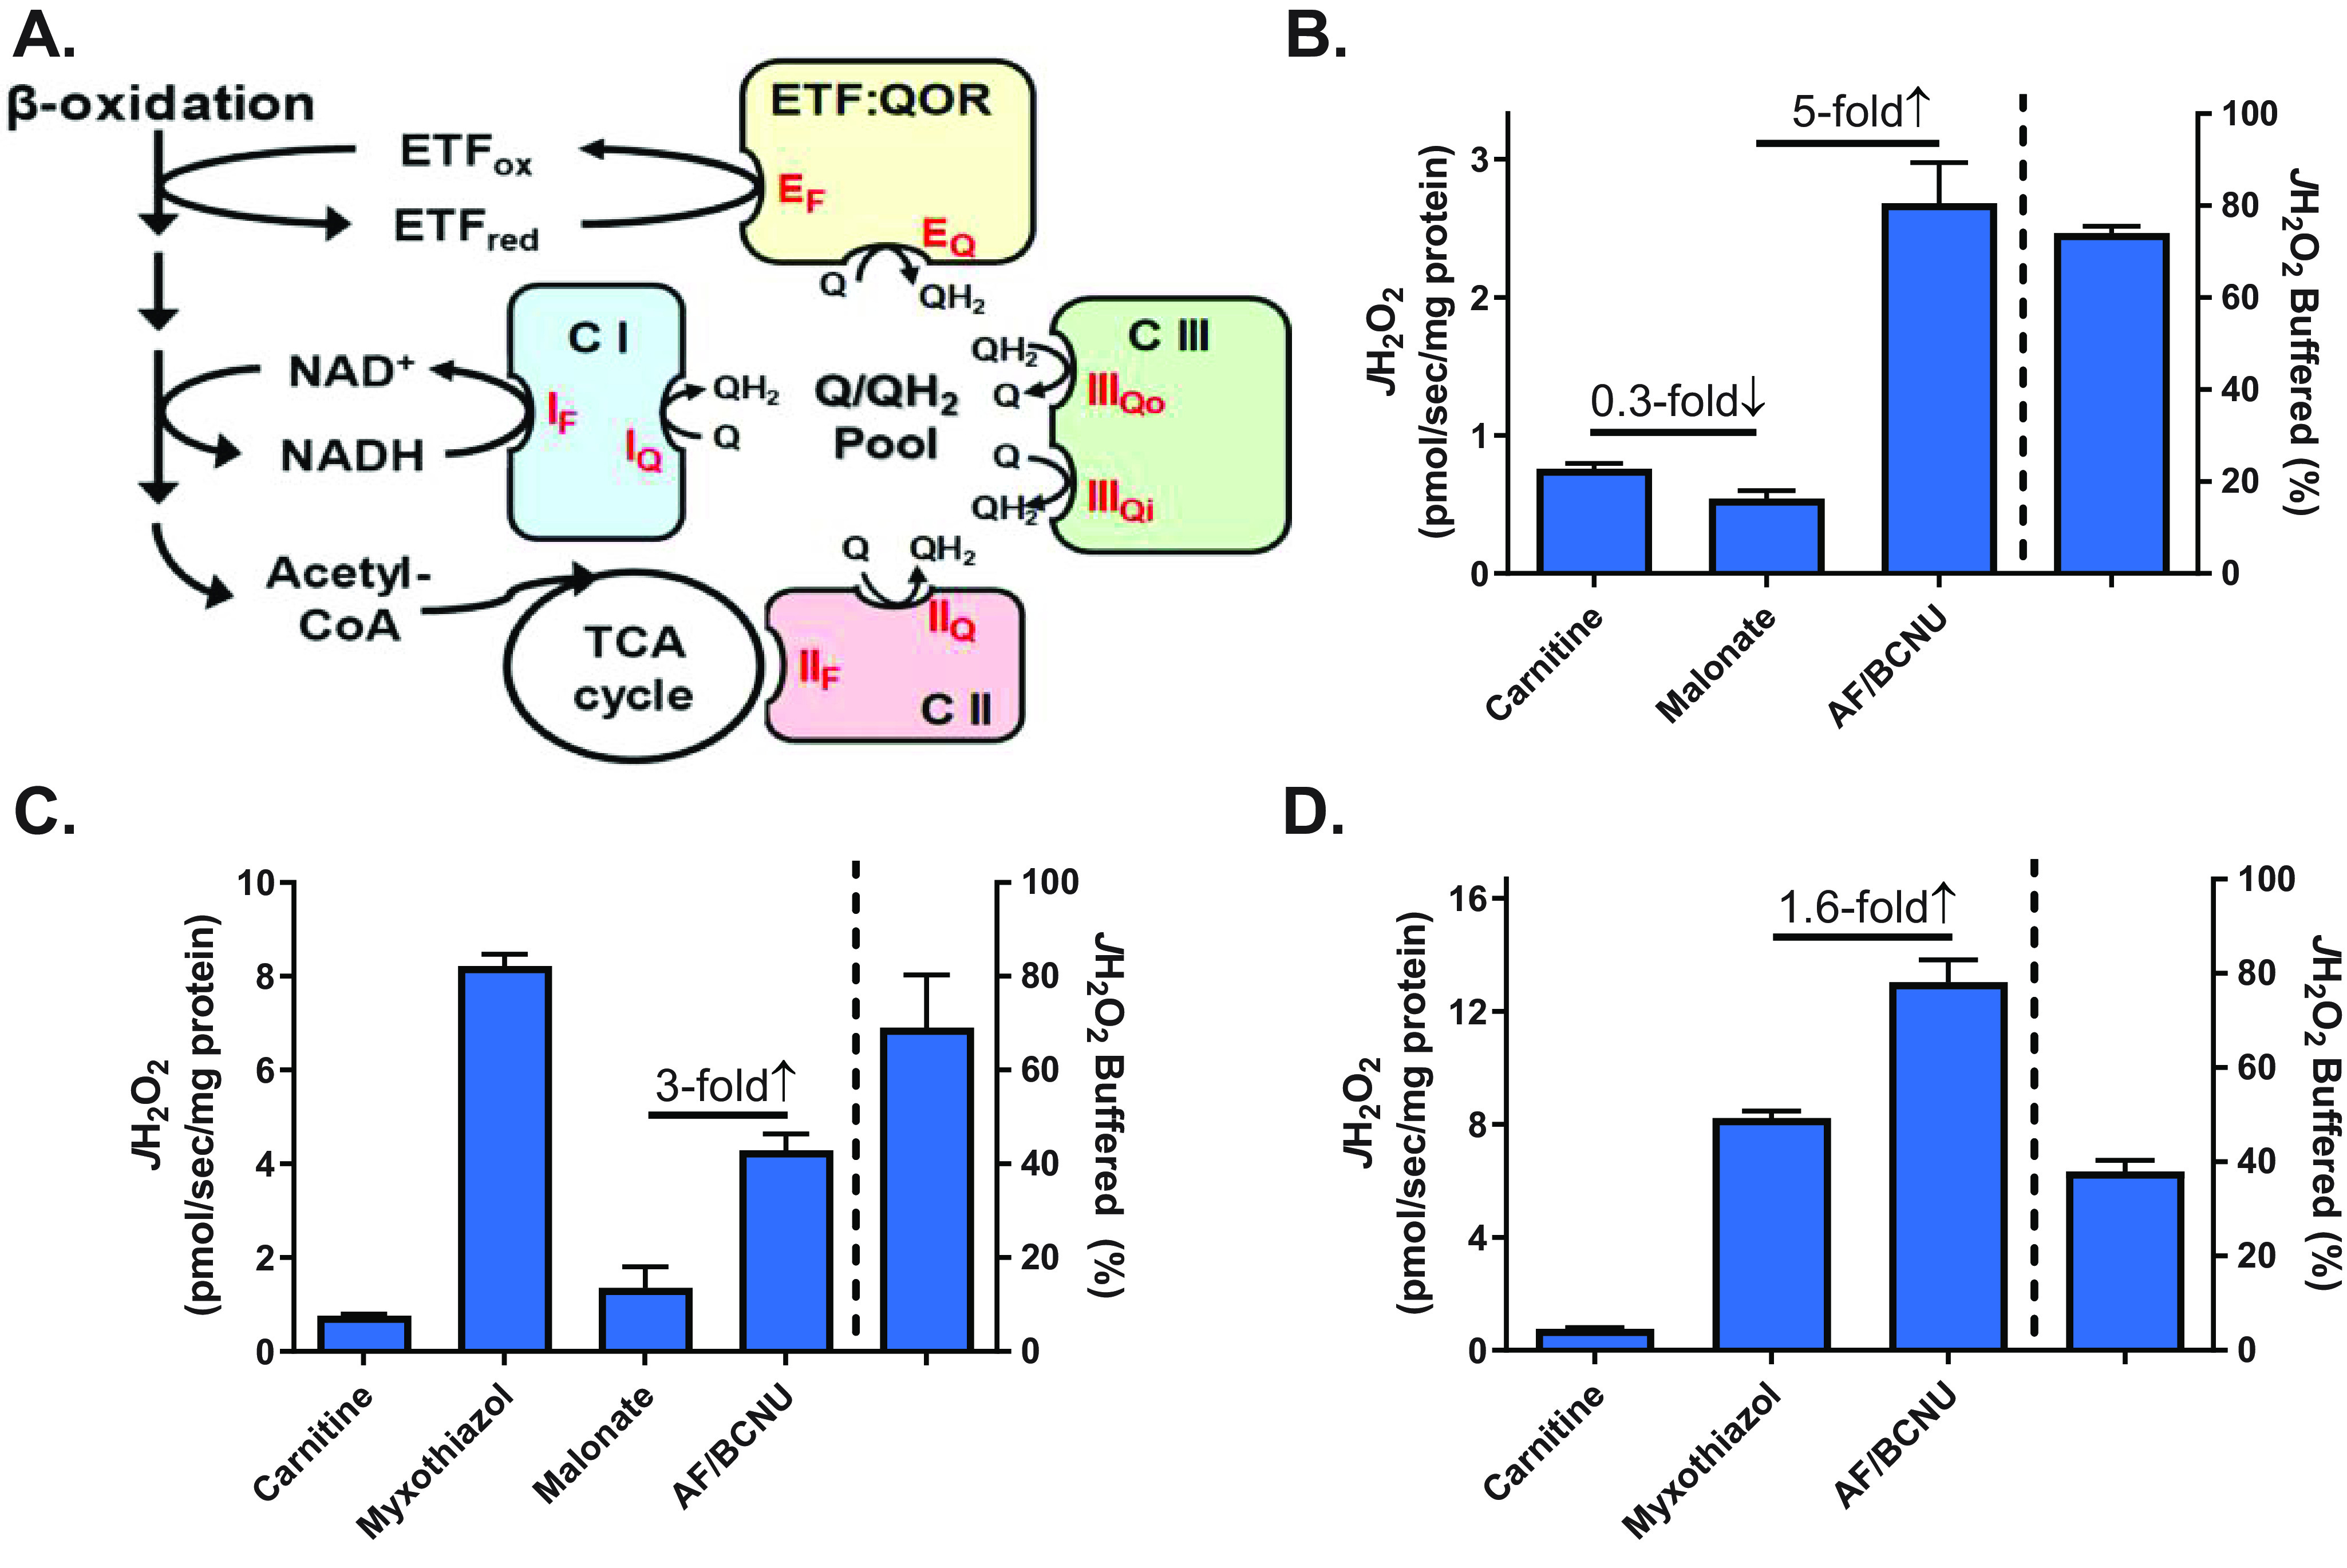
Figure 2.

Integration of site-specific H2O2 production with redox buffering systems. A, schematic depicting specific flavin- and quinone-mediated sites of electron leak ( /H2O2 production, red type) within the β-oxidation pathway and ETS. B, JH2O2 (left y axis) measured in isolated mitochondria from mouse skeletal muscle during basal respiration supported by PCoA (10 μm) plus carnitine (5 mm) followed by the addition of malonate (site IIF inhibitor, 0.5 mm) and AF/BCNU (1 μm/100 μm). The percentage of JH2O2 buffered (right of dotted line, right y axis) is as defined in Fig. 1B. C, JH2O2 measured as in B followed by the addition of myxothiazol (site IIIQ inhibitor, 2 μm), malonate, and AF/BCNU. D, JH2O2 measured as in B followed by the addition of myxothiazol and AF/BCNU. All data are means ± S.E. (error bars); n = 5–6 mice/group.
