Figure 3.
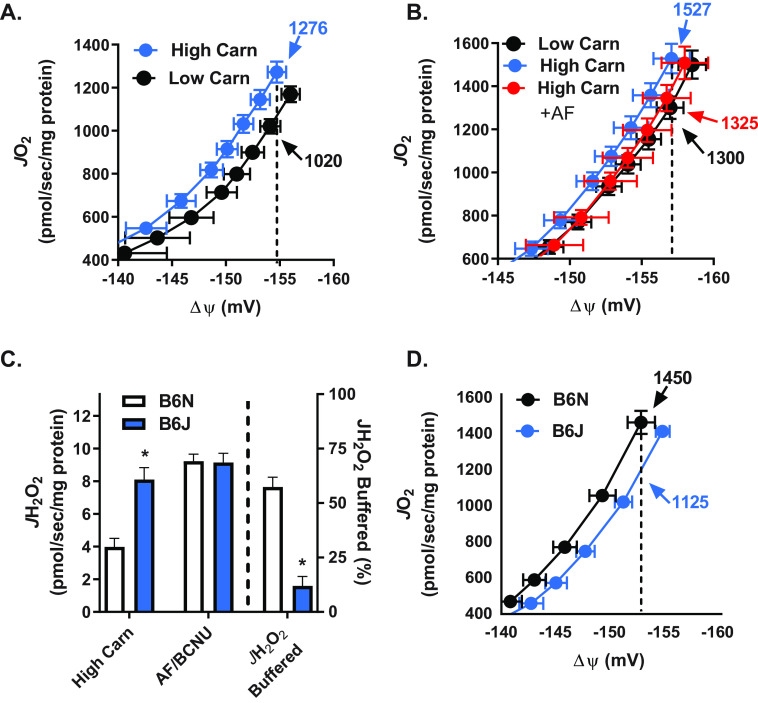
Flux through NNT redox circuits contributes to energy expenditure. A, JO2 as a function of ΔΨm in mitochondria isolated from mouse skeletal muscle during basal respiration supported by PCoA (10 μm), succinate (10 mm), and either low (25 μm) or high (5 mm) carnitine. Note the difference in JO2 (numbers with arrows) at a given ΔΨm (dotted line), indicating difference in proton conductance (i.e. energy expenditure). B, JO2 measured as a function of ΔΨm as described in A in the presence of either low carnitine, high carnitine, or high carnitine plus AF/BCNU (0.1 μm/100 μm). C, JH2O2 (left y axis) measured in mitochondria isolated from skeletal muscle of C57BL/6N (+NNT) and C57BL/6NJ (−NNT) mice during respiration supported by PCoA (10 μm) and high (5 mm) carnitine. The percentage of JH2O2 buffered (right of dotted line, right y axis) is as defined in Fig. 1B. D, JO2 measured as a function of ΔΨm as described in A in mitochondria isolated from skeletal muscle of C57BL/6N (+NNT) and C57BL/6NJ (−NNT) mice. All data are means ± S.E. (error bars); *, p < 0.05 compared with B6N by unpaired t test; n = 6–12 mice/group.

