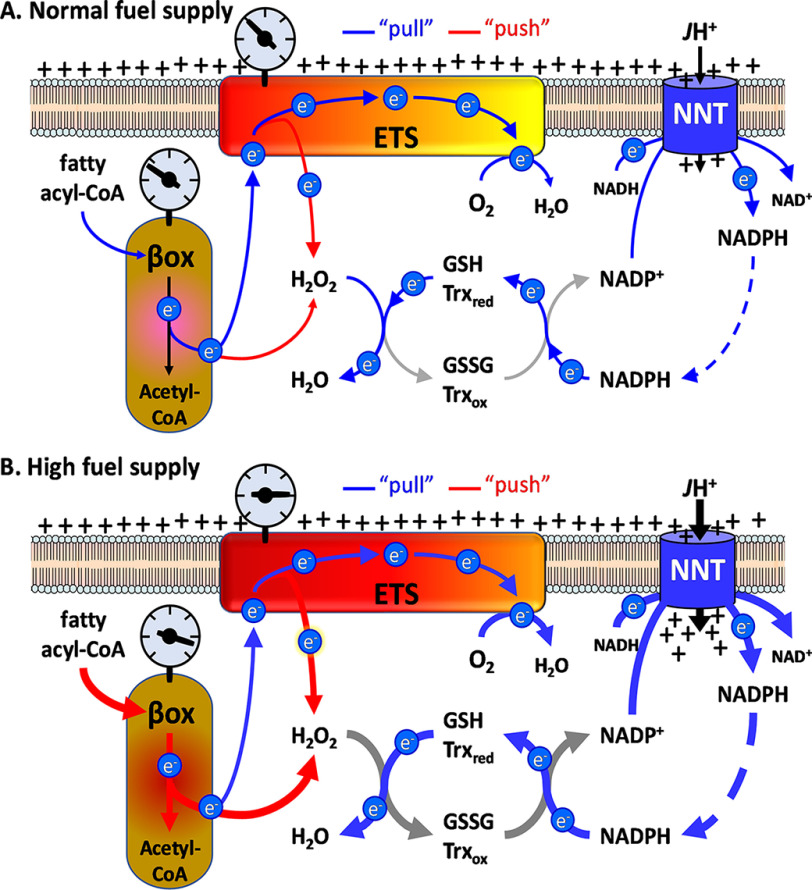
Figure 5.
Schematic showing the integration of JH2O2 with flux rates through NNT-linked redox buffering circuits. A, normal fuel supply. Blue lines indicate the drawing or “pull” of electrons by oxygen through the ETS and β-oxidation pathway and by H2O2 (derived from superoxide, not shown) through the redox buffering circuits from NADPH. Red lines indicate the “push” of electrons as a consequence of reductive stress (oxidation potential indicated by the gray gauges) leading to H2O2 production. JH+ represents the rate of proton conductance through NNT as a consequence of the rate of NAPDH oxidation. B, high fuel supply; as in A showing increase in reductive stress due to high fuel supply relative to demand increasing JH2O2 production, the rate of electron flux through redox buffering circuits, NNT-mediated proton conductance, and thus energy expenditure.

