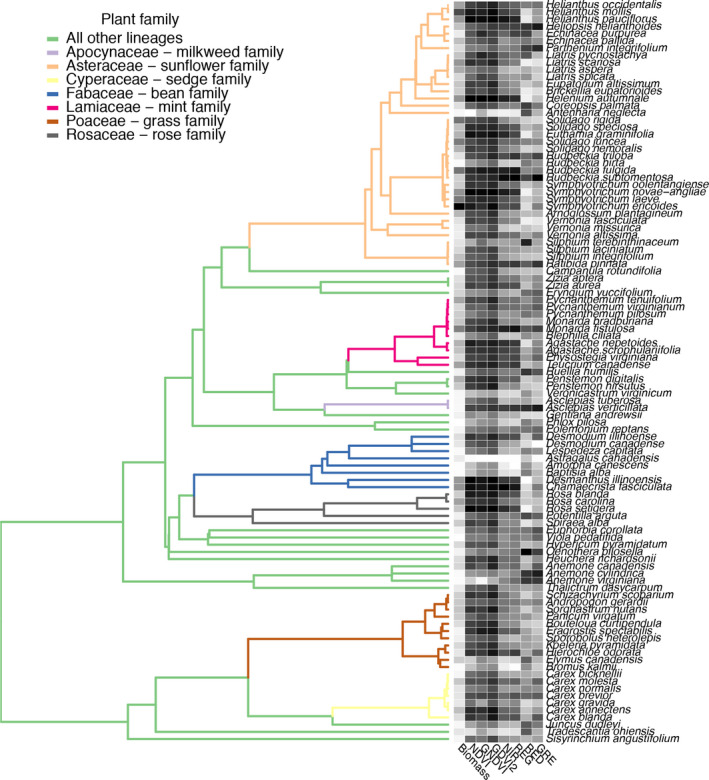
FIGURE 2.

A 127‐species phylogeny with corresponding biomass measurements and spectra mapped. Trait and productivity metrics are all rescaled from 0 (white) to 1 (black); raw measurements can be found in the data sets provided in GitHub (https://github.com/lanescher/prairie-remote-sensing-2020/tree/master/DATA). Colored branches indicate dominant plant families. GRE, green; RED, red; REG, red edge; NIR, near infrared; NDVI, normalized difference vegetation index; GNDVI, green normalized difference vegetation index; GDVI2, generalized difference vegetation index.
