FIGURE 3.

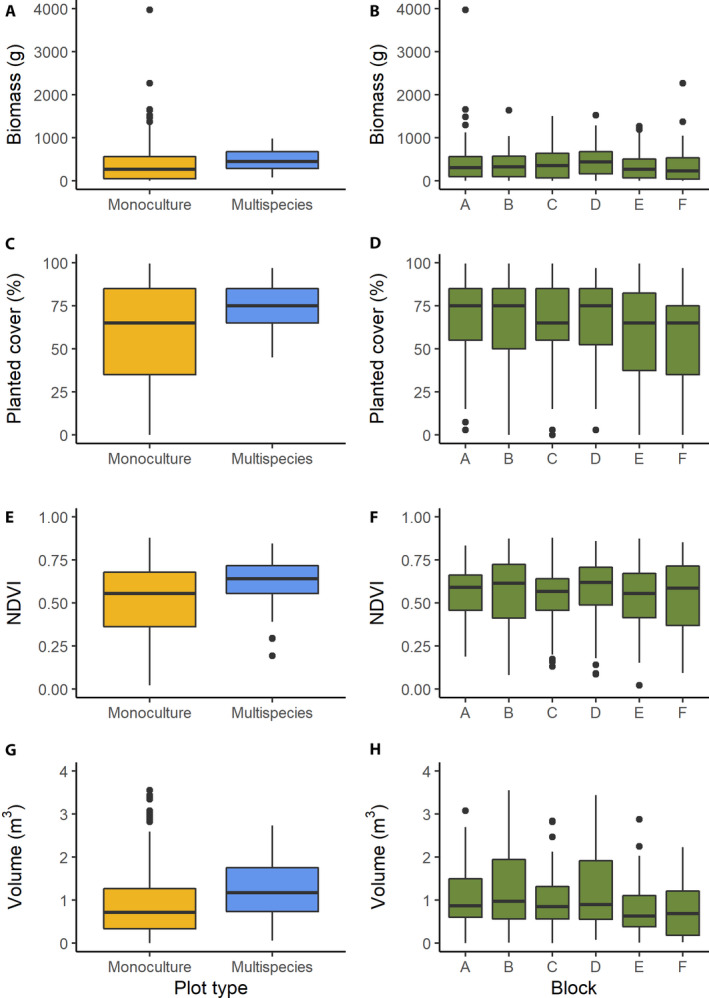
Boxplots of biomass (A, B), planted cover (C, D), NDVI (E, F), and volume (G, H), separated by plot type (A, C, E, G) and block (B, D, F, H).

Boxplots of biomass (A, B), planted cover (C, D), NDVI (E, F), and volume (G, H), separated by plot type (A, C, E, G) and block (B, D, F, H).