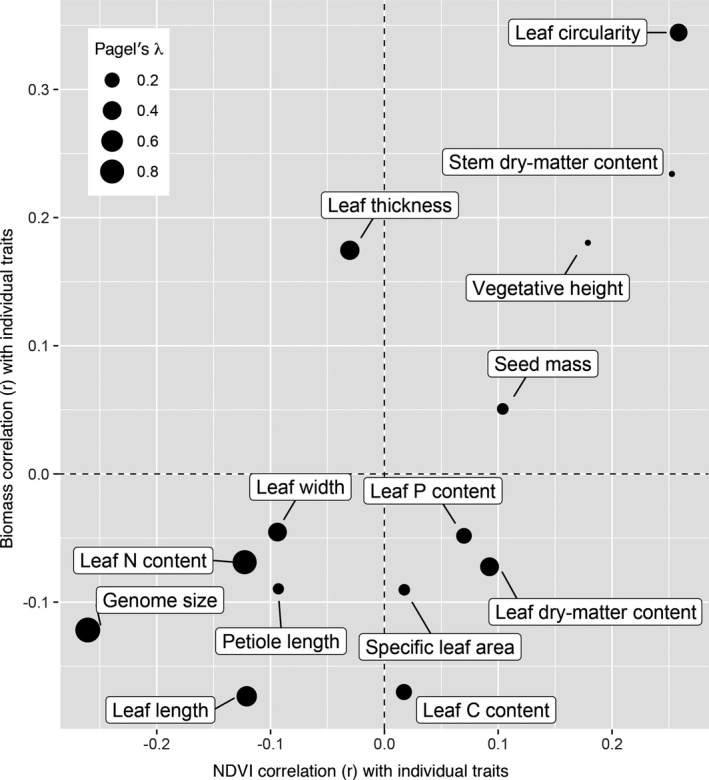
FIGURE 5.

Correlation of biomass and NDVI with individual traits. Size of dots represent phylogenetic heritability, as estimated using Pagel’s λ. The traits with greatest heritability (lower left; i.e., leaf nitrogen [N] content and genome size) are weakly correlated with biomass and NDVI, whereas traits with a high correlation have low heritability (upper right; i.e., stem dry‐matter content, vegetative height).
