FIGURE 3.
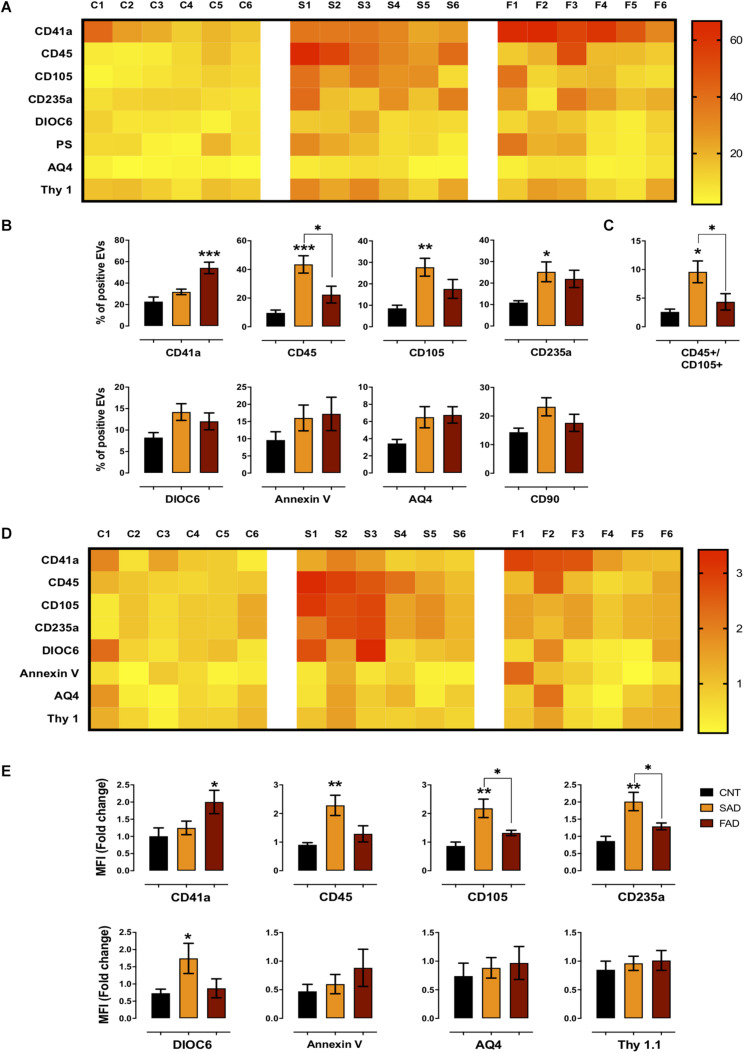
Differential phenotype of SAD- and FAD-EVs. (A) Heatmap of the percentages of EVs positive for cell markers (CD41, platelets; CD45, leukocytes; CD105, endothelia; CD235a, erythrocytes; AQ4, astrocytes; CD90, neuronal-like; Annexin, phosphatidylserine and DIOC6, mitochondria) from each CNT, FAD and SAD sample. (B) Comparison of the percentages of EVs positive for cell markers in the grouped data in panel (A). (C) Percentages of EVs double-positive for markers (CD45, leukocyte; CD105, endothelium) in CNT, FAD and SAD. (D) Heatmap of the normalized MFI of cell markers (to mean data from CNT individuals). (E) Comparison of the normalized MFI of cell markers for the grouped data in panel (C). Representative data from CNT, n = 6; SAD, n = 6; FAD, n = 6. Data are plotted as means and SEM. One-way ANOVA, Tukey’s multiple comparison test.; * indicates p < 0.05; ** indicates p < 0.01; *** indicates p < 0.001.

