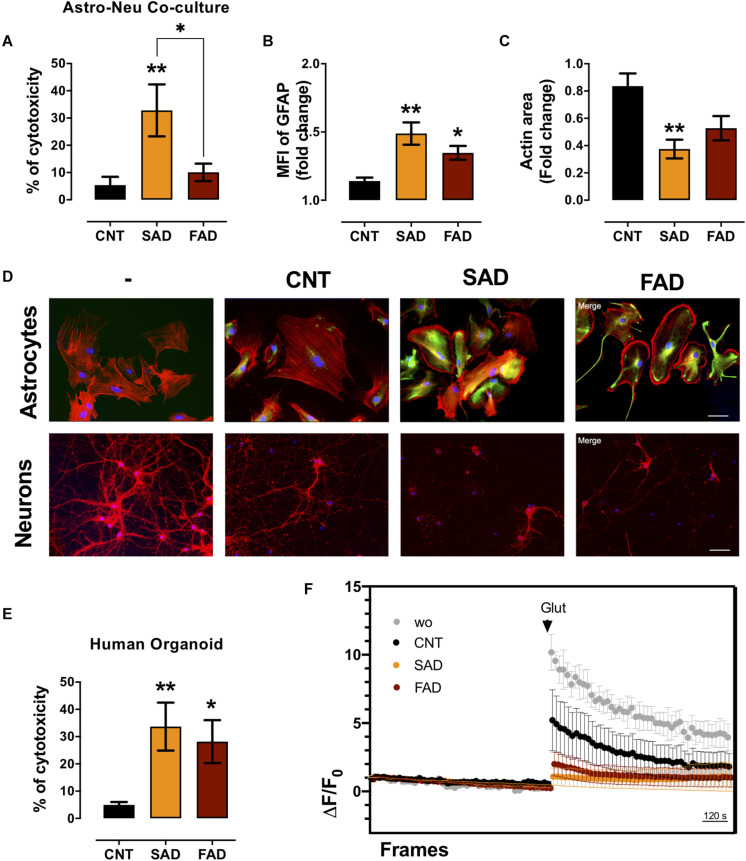
FIGURE 7.
AD-EVs induce neurotoxicity, astrocyte hyperreactivity and calcium dysregulation. (A) The cytotoxicity of astrocyte-neuron cocultures is expressed as the percentage of LDH released from cells 24 h after CNT-, SAD-, FAD-EV treatment. (B,C) Fold change data were calculated by dividing the values by the value obtained from cells with no EV treatment. (B) Fold change of the GFAP intensity (MFI) of astrocytes treated with CNT-, SAD-, FAD-EVs. (C) Fold change of the percentages of F-actin per field of neurons treated with CNT-, SAD-, FAD-EVs. (D) Morphological characterization showing the following: Astrocytes: F-actin is shown in red, the GFAP cytoskeleton is shown in green and nuclei are shown in blue. Magnification 20×, scale bar 100 μm. Neurons: F-actin is shown in red, and nuclei were stained with Hoechst (blue). Magnification 20×, scale bar 100 μm. (E) The cytotoxicity of human organoids is expressed as the percentage of LDH released from cells 48 h after CNT-, SAD-, FAD-EV treatment. (F) Human cortical organoids treated with CNT-, SAD-, FAD-EVs for 48 h were incubated with Fluo4 (cytoplasmic calcium) and were imaged every 20 s for a total of 30 min (15 min to measure baseline activity and 15 min after the addition of 200 μM glutamate). The ΔF/Fo fluorescence ratio was quantified in five fields. For panel (A–F), representative data from CNT, n = 5; SAD, n = 5; FAD, n = 5. In panel (E), representative data from CNT, n = 6; SAD, n = 5; FAD, n = 6. In panel (F), the data represent a pool of EVs from CNT, n = 3; SAD, n = 3; FAD, n = 3. Data are plotted as means and SEM. One-way ANOVA, Tukey’s multiple comparison test. * indicates p < 0.05; ** indicates p < 0.01.

