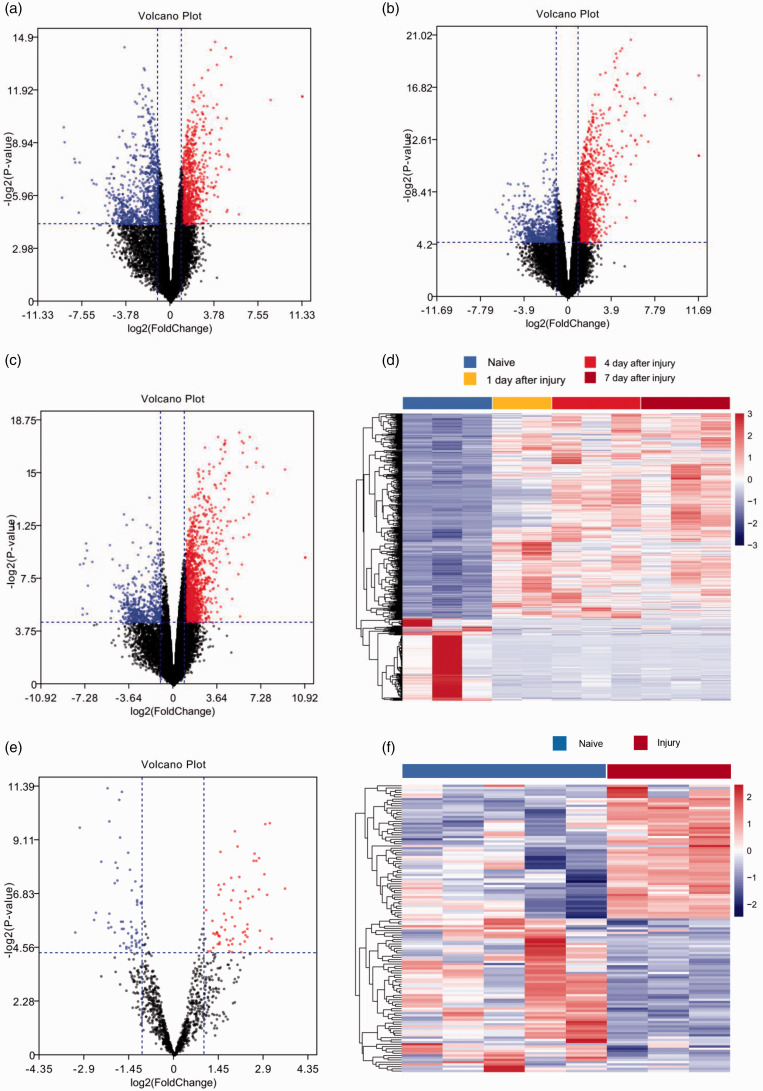
Figure 2.
Volcano plot of the differential gene expression in gene expression datasets GSE111497 and GSE98417. Red indicates upregulated and blue indicates downregulated genes in the normal controls compared to those in the sciatic nerve injury group: (a) long non-coding RNAs (lncRNAs) after 1 day. (b) lncRNAs after 4 days. (c) lncRNAs after 7 days. (e) microRNA (miRNA). Heatmap showing the differential expression of lncRNAs and miRNAs: (d) lncRNAs. (f) miRNAs.

