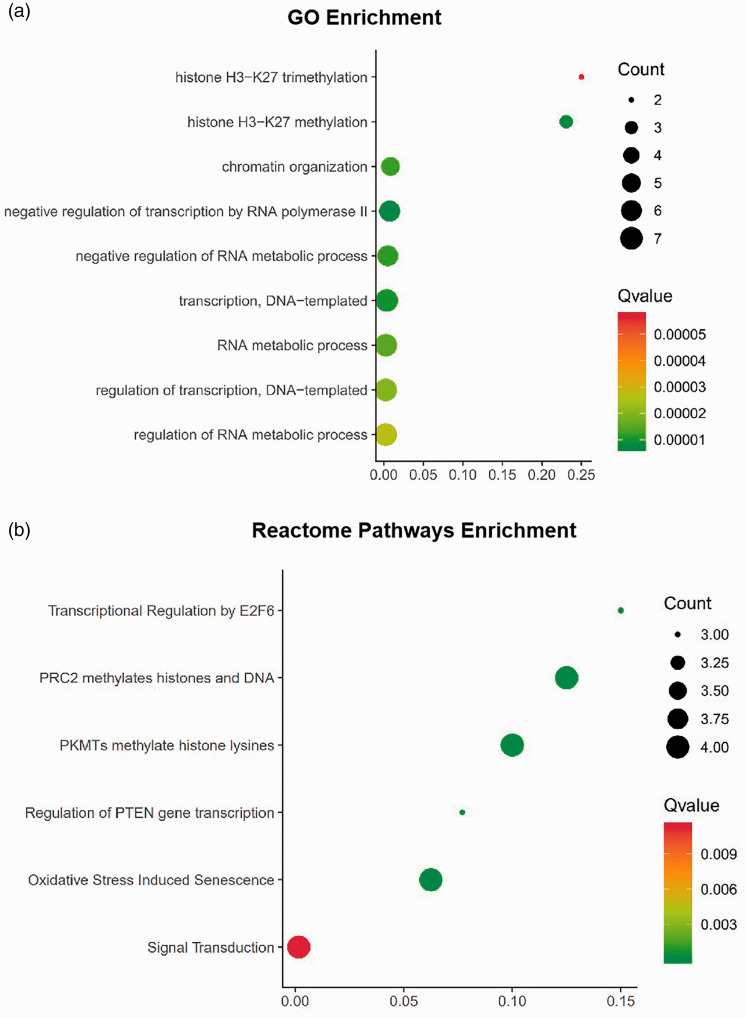
Figure 3.
Functional enrichment of the differentially expressed genes (DEGs). The area of the displayed circles is proportional to the number of genes assigned to the term, and the colour corresponds to the Q value. (a) significantly enriched biological processes (BPs) in gene ontology (GO) analysis of DEGs. (b) Reactome pathways enrichment of DEGs.

