Figure 4.

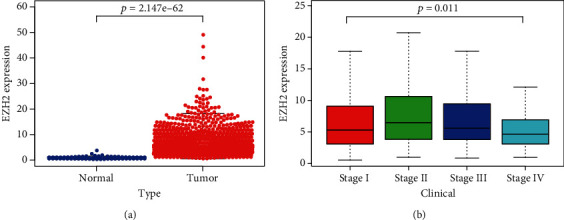
TCGA data analysis. (a) Comparison of EZH2 expression between normal tissue and tumor tissue. (b) Comparison of EZH2 expression between stages of patients with lung cancer.

TCGA data analysis. (a) Comparison of EZH2 expression between normal tissue and tumor tissue. (b) Comparison of EZH2 expression between stages of patients with lung cancer.