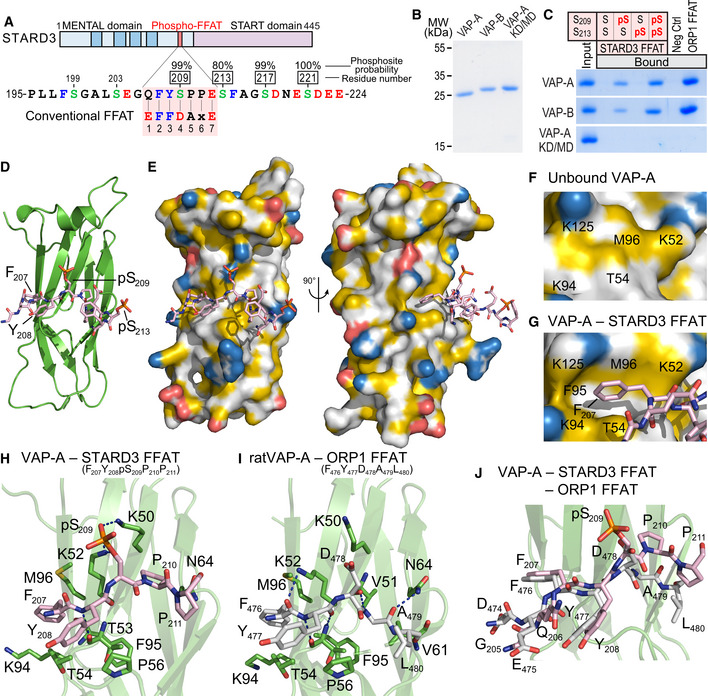
Figure 2. STARD3 has a non‐conventional FFAT motif which needs to be phosphorylated to form a complex with VAP proteins.

-
ASchematic representation of STARD3. Transmembrane helices in the MENTAL domain are in dark blue. The Phospho‐FFAT motif of STARD3 and the conventional FFAT motif sequences are aligned and highlighted in pink. Upper numbers correspond to the position of residues in STARD3. Lower numbers correspond to the position of residues in the FFAT sequence as described in (Loewen et al, 2003). Acidic (D and E), alcoholic (S and T), and aromatic (F and Y) residues are in red, green, and blue, respectively; the other residues are in black. Phosphorylated serines identified by LC/MS/MS are boxed, and the phosphosite probability determined with PhosphoRS is indicated.
-
BCoomassie Blue staining of the recombinant wild‐type MSP domains of VAP‐A and VAP‐B, and of the KD/MD mutant of VAP‐A, after SDS–PAGE.
-
CRecombinant MSP domains pulled down with peptides corresponding to the Phospho‐FFAT motif of STARD3 (unphosphorylated; monophosphorylated on S209 or S213; bi‐phosphorylated on S209 and S213), and with the control peptides were revealed by Coomassie Blue staining. The recombinant proteins subjected to the assay are showed in the input fraction.
-
D, EStructure of the MSP domain of VAP‐A in complex with a Phospho‐FFAT motif. Ribbon diagram (D) and surface representation (E) of the MSP domain of VAP‐A in complex with the Phospho‐FFAT of STARD3 depicted in stick model. The protein surface is colored according to the YRB scheme, showing hydrophobic, negatively and positively charged atoms in yellow, red, and blue, respectively; the other atoms are in white (Hagemans et al, 2015).
-
F, GClose‐up view of the hydrophobic pocket region in the unbound (F) and the Phospho‐FFAT‐bound (G) VAP‐A; residues of VAP‐A constituting the pocket are indicated.
-
HClose‐up view of the structure near the Phospho‐FFAT motif highlighting critical residues (in stick model) of human VAP‐A present in the binding interface.
-
IClose‐up view of the structure near the conventional FFAT of ORP1 as described in (PDBID: 1Z9O; Kaiser et al, 2005), highlighting critical residues of rat VAP‐A involved in the interaction. The nomenclature for rat VAP‐A residues is based on the UniProt sequence (Q9Z270) and not on the PDB file 1Z9O.
-
JSuperposition of the two structures shown in (H) and (I) showing the distinct conformations of the C‐terminal parts of each peptide.
Data information: Phosphorous, nitrogen, oxygen, and sulfur atoms are colored in orange, blue, red, and yellow, respectively. Carbon atoms are shown in green and gray/pink in the MSP domain and the FFAT motif, respectively. The numbers of the peptide residues are noted in subscript.
Source data are available online for this figure.
