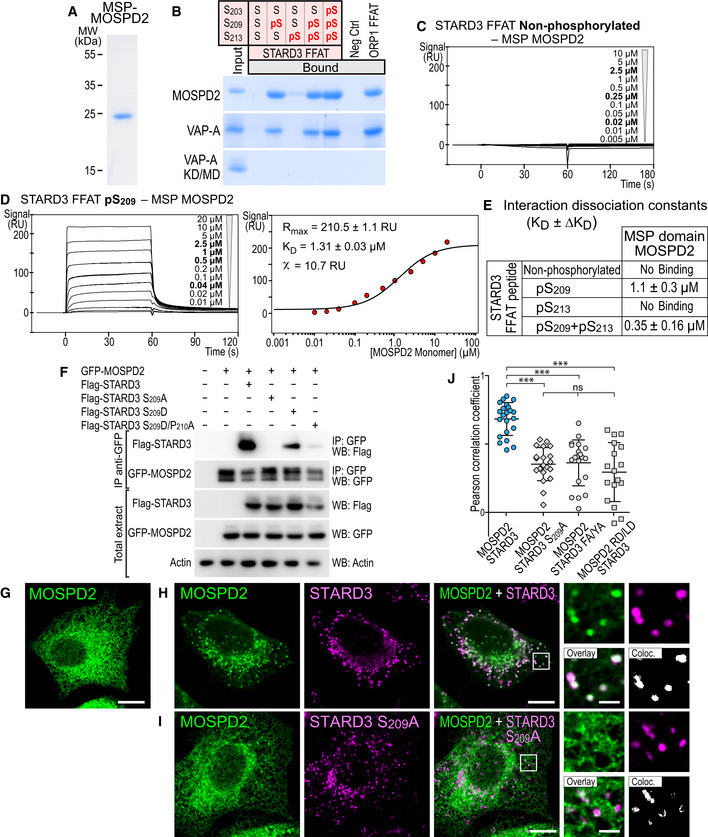
Figure 7. MOSPD2 interacts with the Phospho‐FFAT motif in a phosphorylation‐dependent manner.

-
ACoomassie Blue staining of the recombinant MSP domain of MOSPD2 after SDS–PAGE.
-
BRecombinant MSP domains pulled down with STARD3 FFAT peptides (unphosphorylated, monophosphorylated on S209 or S213, bi‐phosphorylated on S209 and S213, or tri‐phosphorylated on S203, S209 and S213 and control peptides were revealed by Coomassie Blue staining. The recombinant proteins subjected to the assay are shown in the input fraction.
-
C, DSPR analysis of the MSP domain of MOSPD2 binding onto immobilized unphosphorylated (C) and pS209 (D) STARD3 FFAT. Representative sensorgrams resulting from the interaction between the MSP domain of MOSPD2 injected at different concentrations and the different FFAT peptides are shown in (C) and (D left). Binding curves display the SPR signal (RU) as a function of time. Concentrations printed in bold indicate samples measured twice. Signal obtained for the negative control peptide immobilized on another flow cell is systematically subtracted, as well as the bulk effect recorded with buffer only. (D right) Steady‐state analysis of the interaction between pS209 STARD3 FFAT peptide and the MSP domain of MOSPD2. Equilibrium responses (Req) extracted from the left panel were plotted as a function of the monomeric concentration of the MSP domain of MOSPD2, and fitted with a 1:1 binding model. The experiments were performed at 25°C in Tris–HCl 50 mM, pH 7.5, NaCl 75 mM buffer supplemented with 0.005% (v/v) surfactant polysorbate 20 (P20, GE Healthcare). Mean of 2 independent experiments. Uncertainties are obtained from the standard deviation considering a t‐distribution coefficient for a risk factor of 32%.
-
EInteraction dissociation constants between the different STARD3 FFAT peptides and the MSP domains of MOSPD2.
-
FImmunoprecipitation (GFP‐Trap) experiments between GFP‐tagged MOSPD2 and Flag‐tagged STARD3 (WT and S209A, S209D, and S209D/P210A mutants). Approximatively 5 µg of total protein extracts was analyzed by Western blot using anti‐Flag, anti‐GFP and anti‐Actin antibodies. Immunoprecipitated material was analyzed using anti‐Flag and anti‐GFP antibodies.
-
G–IGFP‐MOSPD2‐expressing cells (green) were left untransfected (G) or transfected with Flag‐STARD3 (H) and Flag‐STARD3 S209A (I), and labeled using anti‐Flag (magenta) antibodies. The subpanels on the right are higher magnification (3.5×) images of the area outlined in white. The Overlay panel shows merged green and magenta images. The Coloc panel displays a colocalization mask on which pixels where the green and the magenta channels co‐localize are shown in white. Scale bars: 10 µm.
-
JPearson’s correlation coefficients between MOSPD2 (WT or RD/LD) and STARD3 (WT, S209A, or FA/YA) staining are shown. Each dot represents a single cell (number of cells: MOSPD2–STARD3: 22; MOSPD2– STARD3 S209A: 21; MOSPD2–STARD3 FA/YA: 20; MOSPD2 RD/LD–STARD3: 17, from at least three independent experiments). Means and error bars (SD) are shown. Kruskal–Wallis with Dunn’s multiple comparison test (***P < 0.001).
Source data are available online for this figure.
