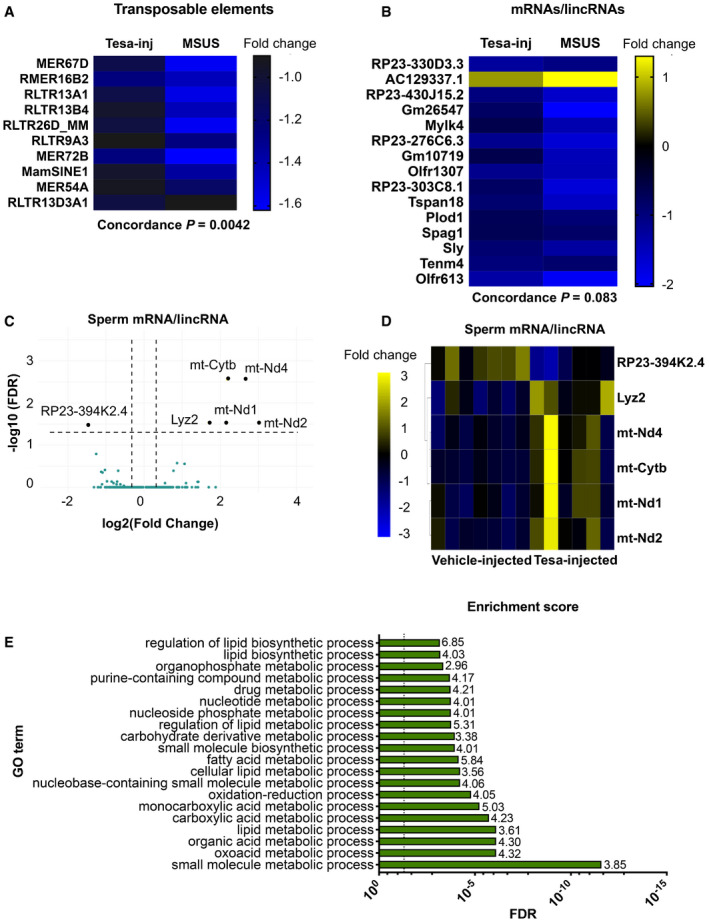
Figure 4. Differential RNA payloads in sperm from tesaglitazar‐injected males and overlap with sperm from MSUS males.

-
A, BDifferentially expressed (A) transposable elements and (B) mRNAs/lincRNAs in sperm from Tesa‐inj and MSUS males. Data represent genes with P < 0.05 and similar fold change. Fold change in heat map represents log2(fold change) respective to the corresponding control group. Total overlap is presented in Extended Data Fig 11.
-
C, D(C) Volcano plot and (D) heat map of differentially expressed (FDR < 0.05) mRNA/lincRNA in sperm from Tesa‐inj males. Dashed black lines in (C) represent y = 1.3, equivalent to FDR = 0.05, and x = ±0.03, equivalent to FC = 1.23 and 0.81. Black dots represent top candidates, which all have FC > 2 or FC < 0.5, and FDR < 0.05. Teal dots represent non‐significant genes.
-
EGO enrichment scores for differential RNA in Tesa‐inj male sperm. Enrichments calculated with P < 0.05. For Tesa‐inj, n = 6; Vehicle‐inj, n = 7; MSUS, n = 4; and control, n = 3. Dashed black line represents FDR = 0.05. FDR, false discovery rate; FC, fold change.
