
Figure 2. BAX/BAK toroidal pore.
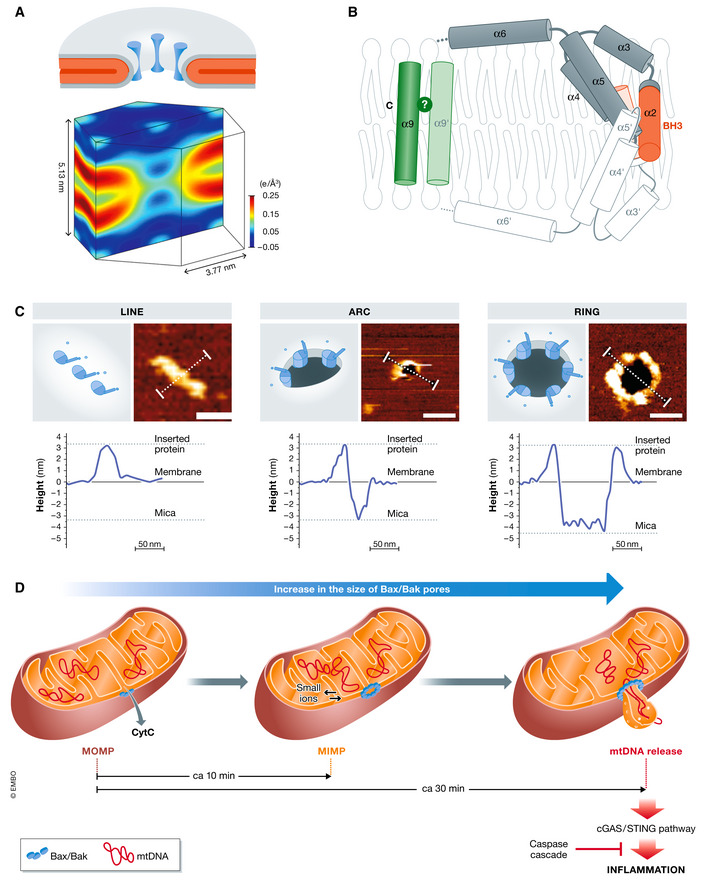
(A) Schematic representations of the protein/lipid model shown as a 3D view cut through the membrane pore. Gray layers represent lipid headgroups of the bilayer, the acyl chains are shown in red and protein helices by dark cylinders (top). The corresponding normalized electron density distributions of acyl chains in lipid bilayers containing BAX α5 (bottom). Note that, unlike in a protein channel, in a toroidal pore: (i) the surface of the pore is lined by lipid headgroups, (ii) membrane monolayers are bent at the pore edge, and (iii) the two leaflets of the bilayer become continuous. Taken from (Qian et al, 2008). (B) Structural representation of membrane‐embedded BAX in the context of a toroidal pore based on (Bleicken et al, 2014; Bleicken et al, 2018). BAX is represented with nine cylinders corresponding to its nine helices. BH3 domain and C‐terminal/tail anchoring domain are depicted in orange and green, respectively. One monomer is shown in gray (1–9) and the other is depicted in white (1ʹ–9ʹ). The relative orientation of the helices α9 remains unresolved. (C) BAX oligomers are organized into line, arc, and rings. Each panel shows the schematic representation (left) and the AFM images (right) of BAX assemblies. Both arcs and rings but not lines, reveal a circular depression (black) that spans the lipid membrane (dark orange). BAX molecules around the pore rim (yellow) protrude above the membrane plane, as confirmed by the height cross‐sections shown below each image (corresponding to the white line in the AFM images). The topography of the arc structure reveals a pore only partially surrounded by BAX molecules, while lipids alone form the rest of the pore rim. Based on (Salvador‐Gallego et al, 2016). (D) Model for the temporal control of content release during MOMP. Upon apoptotic stimuli, BAX and BAK permeabilize the MOM and induce the release of apoptotic factors, for example, cyt C. The consequent MIM permeabilization and the widening of BAX/BAK pores induce the release of mtDNA in the cytosol. In absence of caspase activity, this leads to the activation of the cGAS/STING signaling pathway. Based on (Cosentino & Garcia‐Saez, 2018).