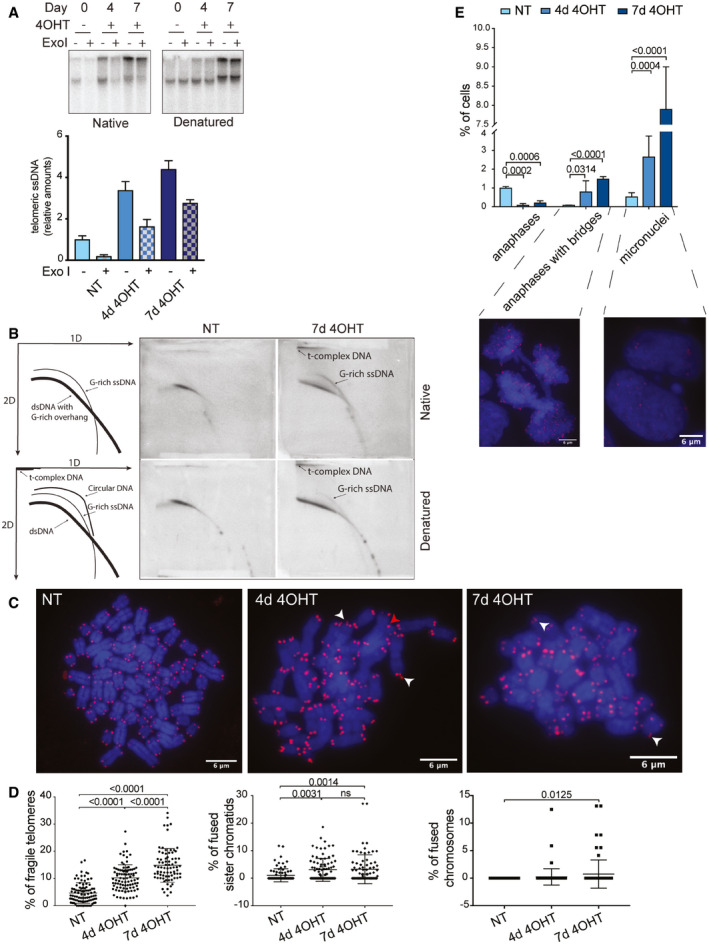
G‐overhang assay for clone 35 upon POT1 removal. The bars show relative amounts of single‐stranded telomeric DNA ± SD. Experiments were performed in triplicate.
2D gels for telomeric DNA from clone 35 cells with POT1 (NT) and upon POT1 removal for 7 days (7d 4‐OHT).
Examples of metaphase spreads for non‐treated (NT) clone 35 cells and clone 35 treated with 4‐OHT for 4 and 7 days. White arrowheads indicate fragile telomeres, the red arrowhead indicates a sister chromatid fusion. Scale bar equals 6 μm.
Quantification of fragile telomeres (left graph), sister chromatid fusions (middle graph), and chromosome fusions (right graph) as a percentage of events per metaphase. Experiments were performed in triplicate. At least 25 metaphases were examined per condition per replicate. The mean is displayed and error bars represent ± SD. Significance was determined using one‐way ANOVA. P‐values are indicated on the graph.
Quantification and representative images of anaphases with bridges and micronuclei for non‐treated (NT) clone 35 cells and clone 35 treated with 4‐OHT for 4 and 7 days. Scale bar equals 6 μm. Experiments were performed in triplicate. The bars show percentage of cells containing anaphases, anaphases with bridges, or micronuclei + SD. At least 650 cells were examined per condition per replicate. Significance was determined using one‐way ANOVA. P‐values are indicated on the graph. In all experiments, POT1 deletion was induced with 0.5 μM 4‐OHT.
Data information: 4‐OHT—4‐hydroxytamoxifen, NT—non‐treated cells.

