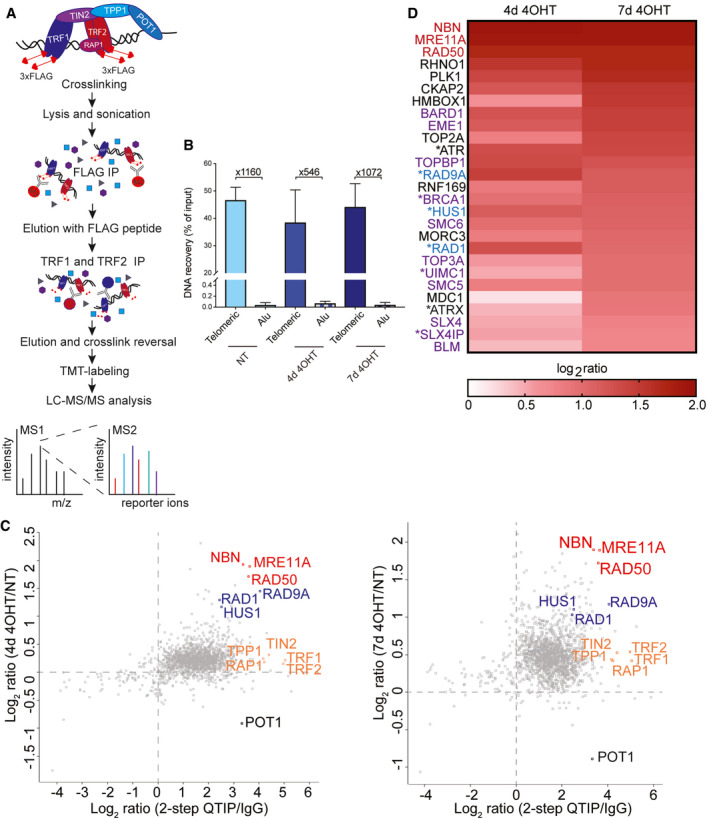
Figure 4. Development of 2‐step QTIP uncovers substantial remodeling of the telomeric proteome upon POT1‐loss.

- Schematic drawing of 2‐step QTIP (improved version of the quantitative telomeric chromatin isolation protocol (QTIP)).
- Quantification of precipitated telomeric DNA in 2‐step QTIP (% of input) and fold enrichment of precipitated telomeric DNA compared with precipitated Alu repeat DNA (based on dot blot analyses). Bars represent data from three independent experiments ± SD.
- Scatter plots representing immunoprecipitation specificity (2‐step QTIP/IgG ratio) vs. difference between non‐treated cells (NT) and cells at day 4 upon 4‐OHT induction (4d 4OHT/NT ratio) or difference between non‐treated cells (NT) and cells at day 7 upon 4‐OHT induction (7d 4OHT/NT ratio), respectively (data from Table EV1). MRN complex in red, 9‐1-1 complex in blue, shelterin complex in orange except for POT1 in black. Values are the average of the 3 biological replicates.
- Heat map representing changes in levels of selected proteins involved in DNA damage (MRN complex in red, 9‐1-1 complex in blue) and HDR proteins (purple) after POT1 knockout induction. Proteins marked with * pass t‐test, but not t‐test with Benjamini–Hochberg correction (P < 0.05, q < 0.09).
