
Figure 2. RNA‐seq differential expression (A‐C) and Proteomics analysis (E&F) in human muscle.
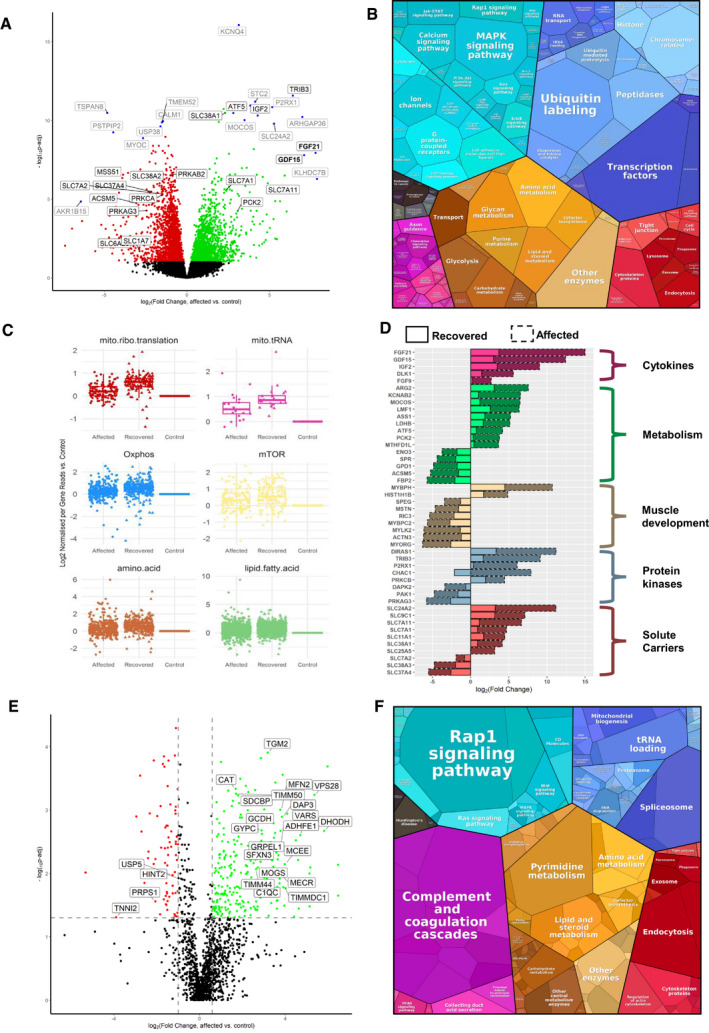
- Volcano plot shows genes where RNA reads are statistically significant under‐ or over‐expressed in five RIRCD affected individuals vs six controls resulted from DESeq2 analysis. Decreased genes are represented in red, the upregulated ones are in green while blue dots highlight most outlying genes (defined by absolute (log2(fold change) + log10(Padj)) > 10). Genes that were not statistically significant are represented in black. Grey and black gene names indicate top 30% of the most dysregulated genes with a highlight on ones involved in metabolism. For the calculation of P‐value or Padj, we have employed the R package DESeq2 where the P‐values obtained by the Wald test are corrected for multiple testing using the Benjamini and Hochberg method by default.
- Representation of the KEGG terms associated with differentially expressed RNAs and their corresponding proteins in five affected patients vs six controls showing major pathway changes in patient muscle (https://bionic-vis.biologie.uni-greifswald.de/).
- Abnormal transcription of genes involved in various biological metabolic pathways derived from our RNA‐seq (RNA‐seq read counts/person/gene for n = 6 RIRCD affected individuals, n = 5 controls and n = 1 (biological replicate analysed in four technical replicates) recovered) data showing that their expression returned close to normal levels in patient muscle after recovery. The central band represents the median, the lower and upper hinges correspond to the first and third quartiles (25 and 75%) while the whiskers extend to the highest and lowest points within the data (1.5× the inter‐quartile range).
- Relevant functional changes in gene expression showing the major genes that return to baseline or contribute to the recovery in RIRCD patients. The data depicted are between the affected and recovered biopsies of the same patient (F6/1M).
- Comparative proteome profiling of proteins that are significantly under‐ or over‐expressed in RIRCD affected vs control individuals (P‐Anova < 0.05‐statistically significant ‐ horizontal line). Proteins which are decreased are represented in red while the upregulated ones are in green while proteins that did not reach statistical significance threshold are marked in black. Vertical lines are delimiting the regulated proteins resulted from the proteomics analysis (the cut‐off values were determined based on the 2× standard deviation and the normal distribution from all identified protein's log2 ratio in which the bell curve is symmetric around the mean, therefore, an average log2 ratio of a protein which < −2.2 or > 0.98 was considered as regulated).
- Proteomap representation of the major altered pathways in RIRCD affected muscle compared to control individuals where the size of each circle or hexagon represents the fold change.