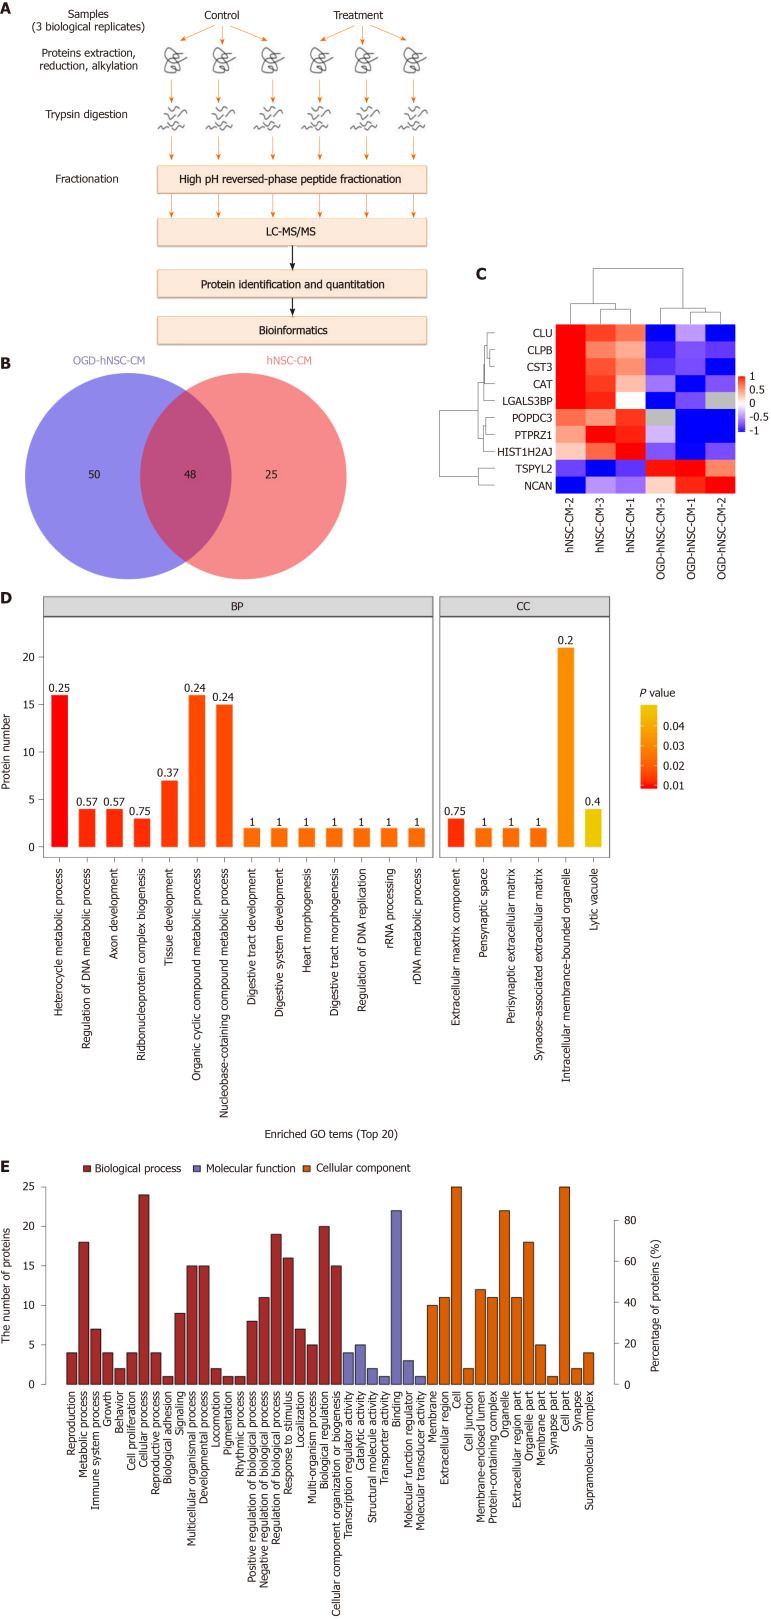
Figure 3.
Protein expression analysis of condition medium derived from human neural stem cells by mass spectrometry. A: The experimental workflow of protein mass spectrometry analysis; B: Venn diagram of the proteins distribution in human neural stem cells-condition medium (hNSC-CM) and oxygen-glucose deprived (OGD)-hNSC-CM; C: Hierarchical clustering of differentially expressed proteins between hNSC-CM group and OGD-hNSC-CM group. Red color indicates higher expression, and green color indicates lower expression; D: The top 20 Gene Ontology functions of predicted targets according to the differentially expressed proteins; E: The biological process, molecular function, and cellular component of the analyzed proteins between hNSC-CM and OGD-hNSC-CM group. OGD: Oxygen-glucose deprived; hNSCs: Human neural stem cells; CM: Condition medium.

