
Fig. 14.
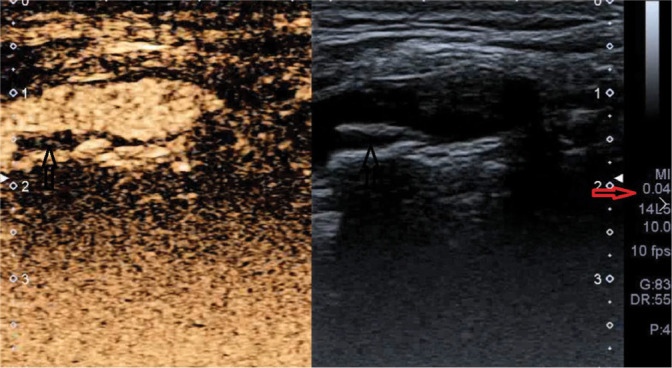
CEUS using the classic method: visible contrast agent microsphere echoes in atherosclerotic plaque’s topography on the posterior wall of the vessel; black arrow – image of plaque with UEA echoes, red arrow – MI value (present authors’ own material)