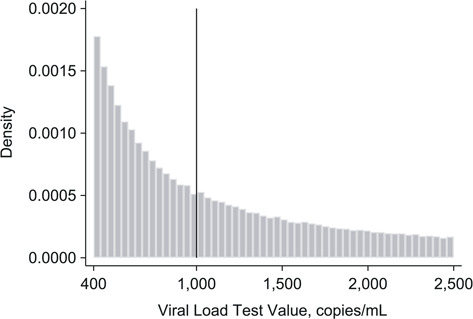
Figure 3.

Histogram of viral load values among patients with an elevated viral load in South Africa, 2013–2015. Plotted histogram of viral load laboratory test values to check for bunching on either side of the 1,000 copies/mL threshold. Lack of bunching around the threshold suggests that patients and providers did not systematically manipulate the assignment variable (viral load values) (n = 191,764).
