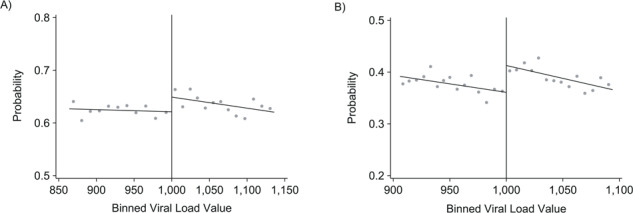
Figure 5.

Intention-to-treat results of eligibility for repeat viral load (VL) testing in South Africa, 2013–2015. Results from regression discontinuity analysis of the effect of VL monitoring within 6 months on retention and viral suppression at 12 months. Gray dots represent sample averages within binned VL values. Black lines represent linear polynomial fits. Plots are generated using data-driven optimal bin lengths and bandwidths from corresponding regression estimates. A) Probability of retention at 12 months. The risk difference at the threshold of 1,000 copies/mL is 2.9% (95% confidence interval: 0.6%, 5.2%). Mean bin lengths are 16.5 to the left of the threshold, and 14.1 to the right of the threshold. Bandwidth is +/− 136 copies/mL. B) Probability of retention and suppression at 12 months. The risk difference at the threshold of 1,000 copies/mL is 5.8% (95% confidence interval: 3.0%, 8.6%). Mean bin lengths are 6.3 to the left of the threshold, and 6.7 to the right of the threshold. Bandwidth is +/− 96 copies/mL.
