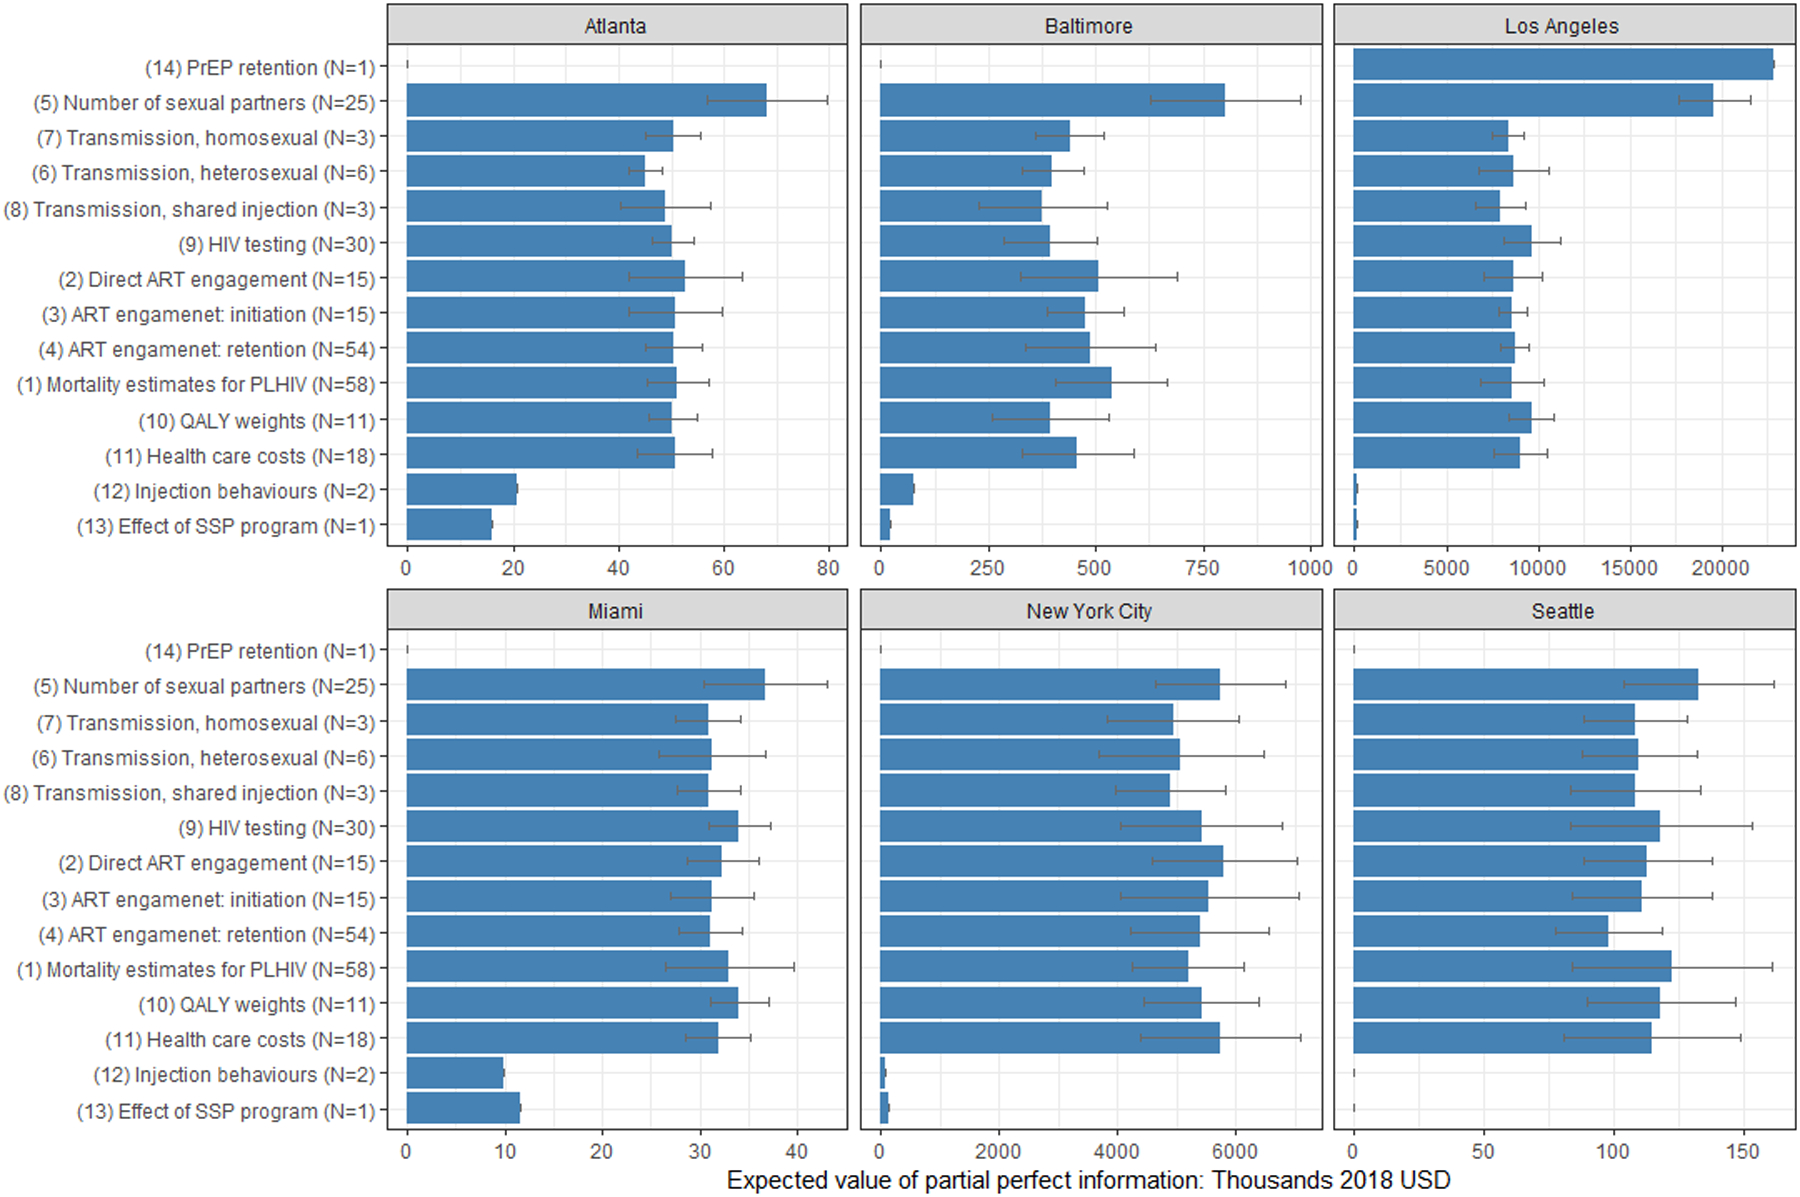
Figure 4. The city-level expected value of partial perfect information for identified parameter groups at a cost-effectiveness threshold of $100,000 per QALY.

Bracketed group indexes correspond to the ones defined in Results section. Parameter groups have been ordered according to the ranking of estimated EVPPI values. The error bars represent the mean ± 1.96 x standard deviation of the estimated values from the ten repeated estimations. Parameters groups with two or fewer parameters were estimated by ANN model and thus had no error bars. N: number of parameters in the given group.
