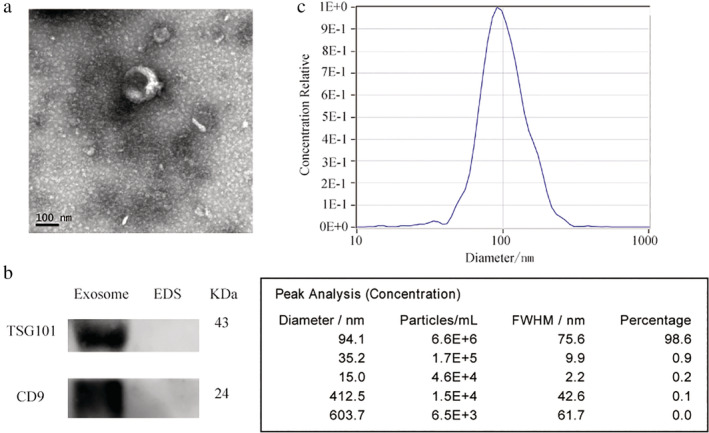
Figure 2.

Identification of serum exosomes. (a) Representative TEM images of serum exosomes as indicated by the arrows. Scale bar, 200 and 500 nm. (b) Western blotting analysis of TSG101 and CD9 in exosomes and exosome‐depleted supernatants (EDS). (c) NTA of the size distribution and number of exosomes.
