
Figure 3.
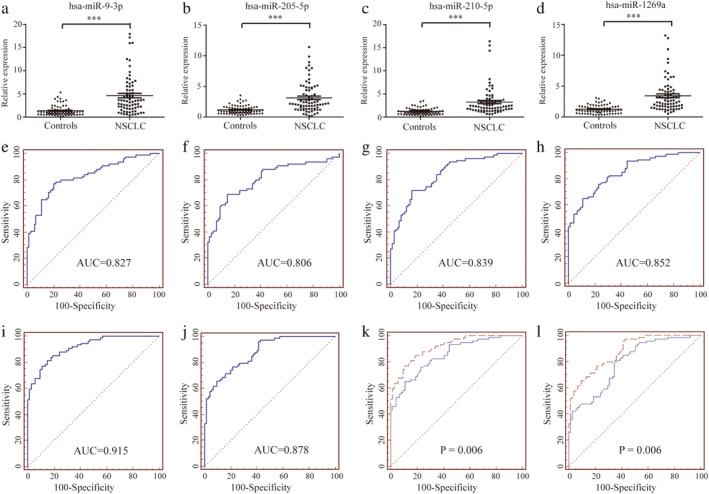
Relative expression and ROC curves analysis of four selected miRNAs in serum exosomes. (a–d) Relative expressions of four selected serum exosomes miRNAs in patients with NSCLC (n = 74) and control individuals (n = 74) using qRT‐PCR assay in training set, P < 0.001. ROC curve analysis for NSCLC detection using hsa‐miR‐9‐3p (e), hsa‐miR‐205‐5p (f), hsa‐miR‐210‐5p (g) and hsa‐miR‐1269a (h) in the training set. ROC curves analysis for the prediction of NSCLC using four‐miRNA panel in training set (i) and validation set (j). Comparison of diagnostic performance between four‐miRNA panel and hsa‐miR‐1269a for NSCLC detection in training set (k)  , Four‐miRNA panel;
  , hsa‐miR‐1269a and additional validation set (l)
  , Four‐miRNA panel;
  , hsa‐miR‐1269a.