
Figure 5.
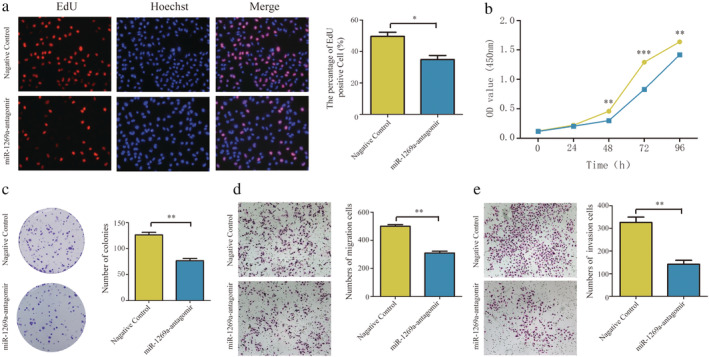
Downregulation of miR‐1269a inhibited proliferation, migration and invasion of A549 cells. (a) The EdU assay was performed to determine the proliferation of miR‐1269a antagomir‐transfected or negative controls‐transfected A549 cells. (b) CCK8 viability assays were performed 0, 24, 48, 72 and 96 hours after transfection with miR‐1269a antagomir or negative controls  , Negative control;
  , miR‐1269a‐antagomir. (c) Representative images and quantitative results of colony formation were obtained after transfection. (d and e) Representative images and quantitative results of the transwell assay were obtained after the transfection of miR‐1269a antagomir or negative controls. All experiments were repeated at least three times, and representative data are shown. Data are means ± SEM. *P < 0.05, **P < 0.01, ***P < 0.001.