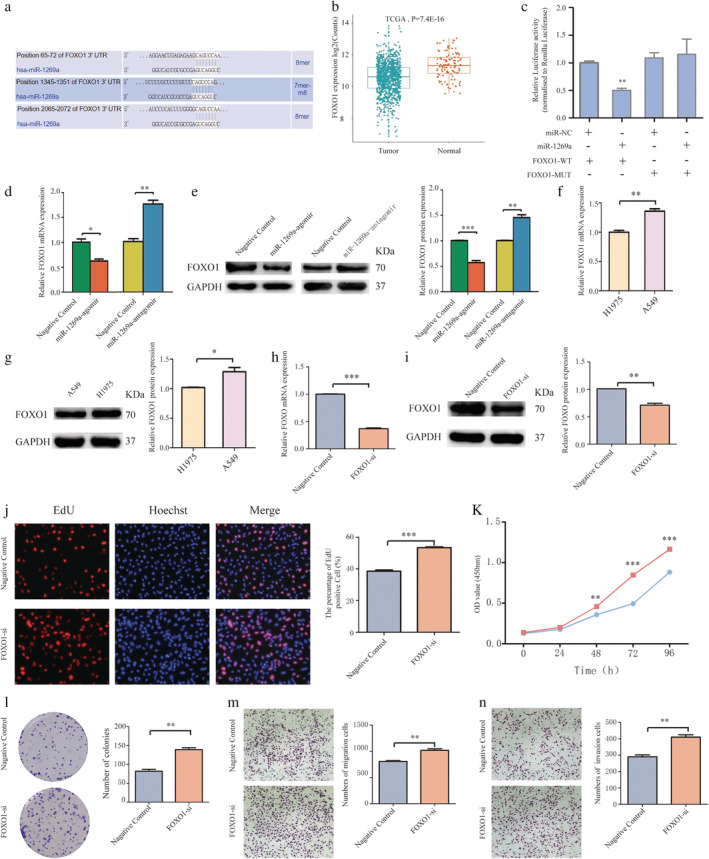
Figure 6.

FOXO1 was the direct target of miR‐1269a in NSCLC (a) Bioinformatics analysis showed that there were three regulatory sites on FOXO1 3'‐UTR for miR‐1269a. (b) Relative expression of FOXO1 in NSCLC compared with normal tissue was analyzed by using TCGA database. (c) The luciferase reporter plasmid containing WT‐ and Mut‐FOXO1 was cotransfected into HEK293T cells with miR‐1269a in parallel with negative controls. (d and e) Relative mRNA and protein levels of FOXO1 in NSCLC cells transfected with miR‐1269a agomir, miR‐1269a antagomir or negative controls. (f and g) FOXO1 expression was measured in H1975 and A549 cells using qRT‐PCR and western blot analyses. (h and i) qRT‐PCR and western blot analyses were used to detect the effect of si‐FOXO1 in A459 cells. (j) Representative images and quantitative results of the EdU assay were obtained after the transfection of si‐FOXO1 or negative controls. (k) CCK8 viability assays were performed 0, 24, 48, 72 and 96 hours after transfection  , Negative control;
  , FOXO1‐si. (l) Representative images and quantitative results of colony formation were obtained after transfection. (m and n) Transwell assay was performed to determine the migration and invasion of si‐FOXO1‐transfected or negative controls‐transfected A549 cells. All experiments were repeated at least three times, and representative data are shown. Data are means ± SEM. *P < 0.05, **P < 0.01, ***P < 0.001.
