
Figure 7.
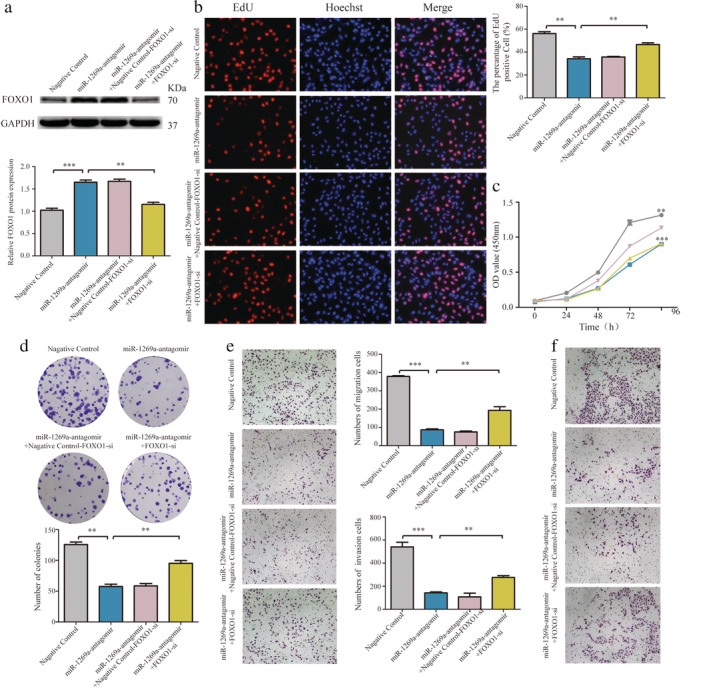
MiR‐1269a regulated NSCLC cell function via inhibiting FOXO1. (a) The FOXO1 protein levels were determined by western blotting in A549 cells. (b) EdU assay of the proliferation of A549 cells transfected with negative controls, miR‐1269a antagomir, miR‐1269a antagomir plus negative controls‐FOXO1‐siRNA, miR‐1269a antagomir plus FOXO1‐siRNA. (c) Cell proliferation ability in A549 cells treated with negative controls, miR‐1269a antagomir, miR‐1269a antagomir plus negative controls‐FOXO1‐siRNA, miR‐1269a antagomir plus FOXO1‐siRNA were measured by the CCK8 assay  , Negative control;
  , miR‐1269a‐antagomir + Negative control‐FOXO1‐si;
  , miR‐1269a‐antagomir;
  , miR‐1269a‐antagomir+FOXO1‐si. (d) Cell growth ability was measured by colony formation assay after transfection. (e and f) Representative images and quantitative results of transwell assay were obtained after transfection. All experiments were repeated at least three times, and representative data are shown. Data are means ± SEM. *P < 0.05, **P < 0.01, ***P < 0.001.