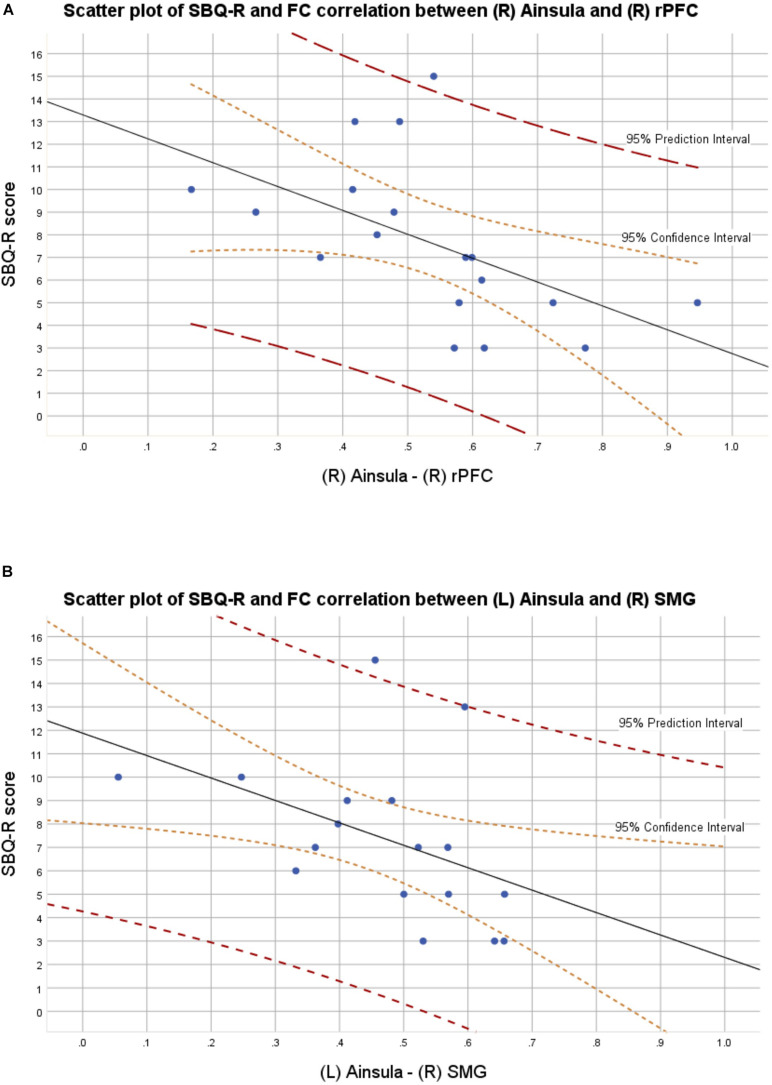
FIGURE 2.
(A) Scatter plot with confidence and prediction intervals showing association between SBQ-R scores and raw functional connectivity values between right insula and right rostral prefrontal cortex in euthymic BD patients. (B) Scatter plot with confidence and prediction intervals showing association between SBQ-R scores and raw functional connectivity values between left insula and right supramarginal gyrus in euthymic BD patients.

