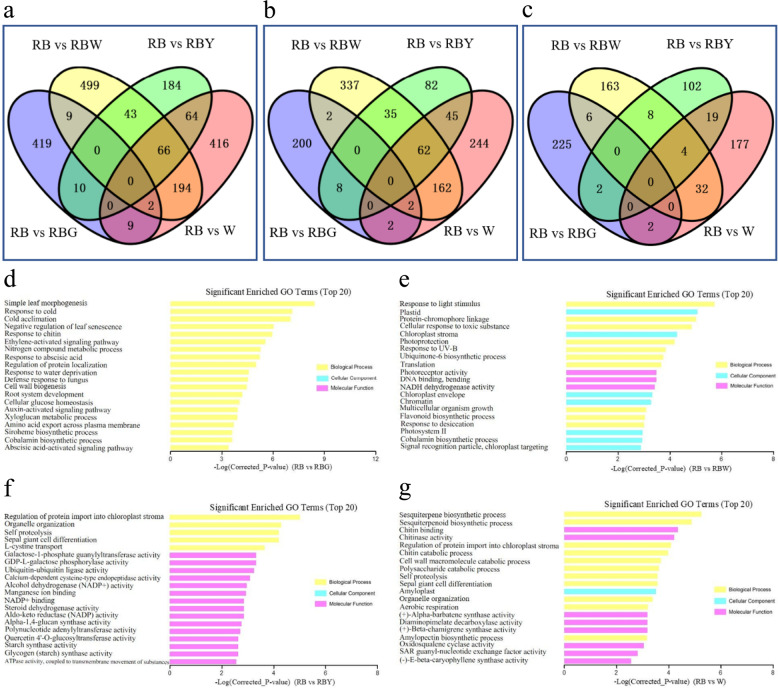
Fig. 5. Venn diagram and top 20 significantly enriched GO terms of the differentially expressed genes (DEGs).
a Total DEGs, b upregulated DEGs, c downregulated DEGs; d–g top 20 significantly enriched GO terms in the RB vs. RBG, RB vs. RBW, RB vs. RBY, and RB vs. W comparisons at the P < 0.05 level. DEGs screened with |log2(FC) | ≥ 1.0, P < 0.05 and false discovery rate (FDR) < 0.05 among four pairwise comparisons. FC fold change, RB red–blue light, RBG red–blue–green light, RBW red–blue–white light, RBY red–blue-yellow light, W white light

