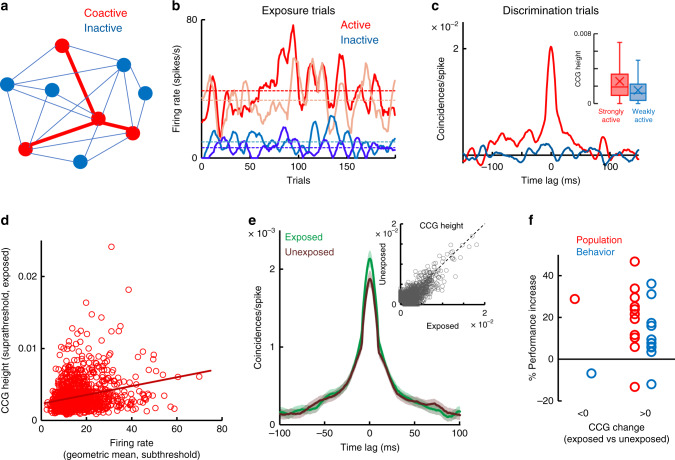
Fig. 5. Subthreshold stimulus exposure increases functional connectivity.
a Cartoon illustrating that exposure to two-frame stimuli activates specific neurons (active cells shown in red) leading to increased functional connectivity (red lines) when the same stimuli are presented above threshold. b Example trial-by-trial firing rates during the 34 ms stimulus exposure for a pair of active (red traces) and inactive neurons (blue traces). c Cross-correlograms (using the 300-ms stimulus interval during discrimination) for the pairs of active and inactive neurons from b. (inset) Average CCG peak height of strongly active and weakly active cell pairs (top and bottom thirds of all pairs, n = 814 each). d CCG peak of neurons during suprathreshold presentation of exposed images is strongly correlated with geometric mean firing rate of cells during subthreshold exposure (R = 0.241, P = 5.7 × 10⁻¹⁸, Pearson correlation). e Average CCG amplitude of pairs during the subsequent presentation of exposed stimuli during the task is significantly larger than CCG amplitude during the presentation of unexposed images (considering all pairs with significant CCG). The range of time lags around the central CCG bin is ±100 ms. Each cross-correlogram is shuffle corrected and normalized by mean firing rates. Error bands represent sem. (inset) Two-frame exposure increases spike time correlations between cell pairs (P = 3.41 × 10⁻³⁰, n = 1649 pairs, Wilcoxon sign-rank test). Each dot represents the CCG peak for a pair of cells responding to exposed and unexposed images. f Mean changes in population decoding and behavioral performance as a function of mean changes in CCG amplitude for exposed vs unexposed stimuli. Each circle represents an individual session. The mean CCG changes have been divided based on whether they were negative or positive.

