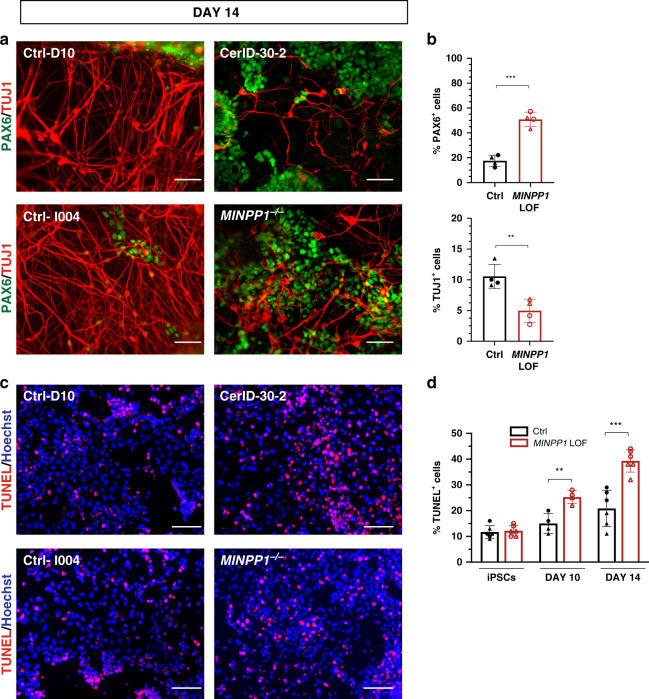
Fig. 3. MINPP1 loss causes an early neuronal differentiation defect combined with an increase in apoptosis.
a Control (Ctrl-D10 (filled circle) and Ctrl-I004 (filled triangle)) and MINPP1 LOF (patient-derived (CerID-30-2 (blank circle) and MINPP1−/− (blank triangle)) iPSCs were differentiated toward neuronal lineage for 14 days. Representative images of the differentiated cells stained with early neuronal marker TUJ1 and neural progenitor marker PAX6. Hoechst was used as a nuclear stain. b Quantitative analysis of the immunofluorescence data. c Representative images of TUNEL staining during neuronal differentiation at day 14. d Quantification of the TUNEL assay during neuronal differentiation (iPSC, day 10 and day 14). All scale bars correspond to 50 μm. (For (b, c), n = 4, for (d), n = 6 for iPSCs and day 14, n = 4 for day 10. Duplicate/triplicate analysis of two independent experiments. Two-tailed student’s t-test, **p ≤ 0.01 and ***p ≤ 0.001. For (b) upper panel, Ctrl vs. MINPP1 LOF: p = 0.0001; for (b) lower panel, Ctrl vs. MINPP1 LOF: p = 0.0066; for day 10 data (d), Ctrl vs. MINPP1 LOF: p = 0.0045 and for day 14 data (d), Ctrl vs. MINPP1 LOF: p = 0.0003). The data are presented as mean percentage values ± s.d. For (b) and (d), source data are provided as a source data file.

