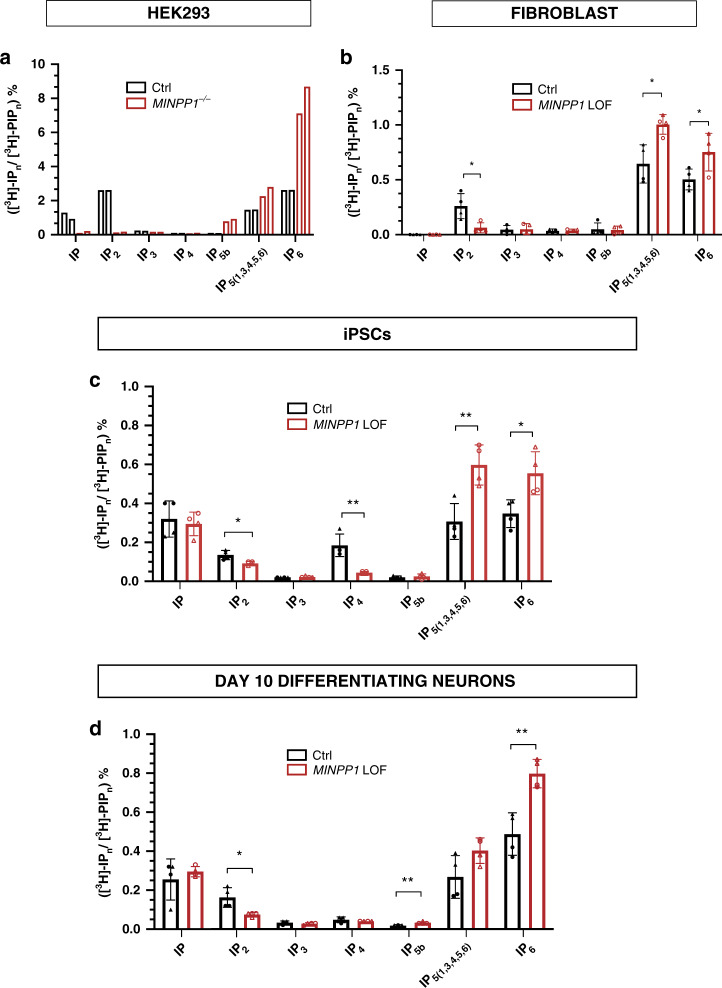
Fig. 4. MINPP1 absence leads to disruption in inositol phosphates metabolism.
a–d SAX-HPLC analysis of inositol phosphate levels in MINPP1−/− HEK293 cells (a), patient fibroblasts (CerID-30-1 and CerID-30-2) (b), MINPP1 LOF (patient-derived (CerID-30-2 (blank circle) and MINPP1−/− (blank triangle)) iPSCs (c), and their day-10 differentiating neuron counterparts (d). The peaks ([3H]-IPn) were identified based on comparison to standards. [3H]-IPn levels are presented as percentage of total radioactivity in the inositol-lipid fraction ([3H]-PIPn). All error bars represent standard deviation (s.d.). (For (a), n = 2 and both experiments are represented. For (b–d), n = 4, two-tailed student’s t-test, *p ≤ 0.05 and **p ≤ 0.01). IPn, inositol phosphates; PIPn, phosphatidylinositol phosphates. Source data are provided as a source data file.

