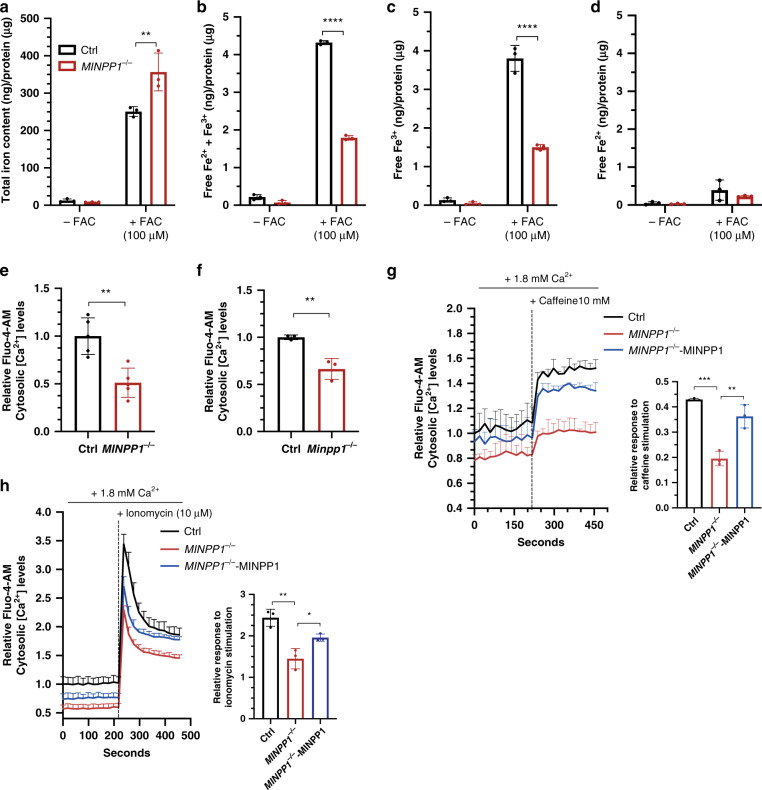
Fig. 5. Altered iron and calcium homeostasis in the absence of MINPP1 enzyme in HEK293 and Minpp1−/− mouse neural progenitor cells.
a–d Quantification of total iron content (a), free iron (Fe2+ and Fe3+) (b), Fe3+ (c), and Fe2+ (d) levels in extracts from control and MINPP1−/− HEK293 cells grown under low (−FAC) and high iron (+FAC, 100 µM) conditions. All values are normalized to the total protein concentration and represent the mean ± s.d (n = 3, two-way ANOVA Sidak test, **p ≤ 0.01 and ****p ≤ 0.0001. For (a), Ctrl vs. MINPP1−/−: p = 0.0023; for (b), Ctrl vs. MINPP1−/−: p ≤ 0.0001, and for (c), Ctrl vs. MINPP1−/−: p ≤ 0.0001). e, f Relative Fluo-4-AM cytosolic Ca2+ levels in control and MINPP1−/− HEK293 cells (e), wild-type (WT) and Minpp1−/− E14 mouse neural progenitors (f). g, h Relative Fluo-4-AM cytosolic Ca2+ levels in control, MINPP1−/− and MINPP1-overexpression stable line in MINPP1−/− HEK293 cells (MINPP1−/−-MINPP1) loaded either with 10 mM caffeine (g) or 10 µM ionomycin (h). The dotted line indicates the addition of either caffeine (g) or ionomycin (h). Relative response after caffeine or ionomycin stimulation (peak) is represented graphically (inset). For all of the calcium assay experiments, the data are normalized to cell number with MTT colorimetric assay and presented as mean values relative to control baseline fluorescence intensity control ± s.d. ((e) n = 5; (f) N = 3 mice, (g, h) n = 3, two-tailed student’s t-test (e, f) and one-way ANOVA, Tukey’s post hoc test (g, h), *p ≤ 0.05, **p ≤ 0.01, ***p ≤ 0.001). For (e), Ctrl vs. MINPP1−/−: p = 0.0021; for (f), Ctrl vs. Minpp1−/−: p = 0.007; for (g), Ctrl vs. MINPP1−/−: p = 0.0002; MINPP1−/− vs. MINPP1−/−-MINPP1: p = 0.0015; for h Ctrl vs. MINPP1−/−: p = 0.0018; MINPP1−/− vs. MINPP1−/−-MINPP1: p = 0.0402. For all panels, source data are provided as a source data file.

