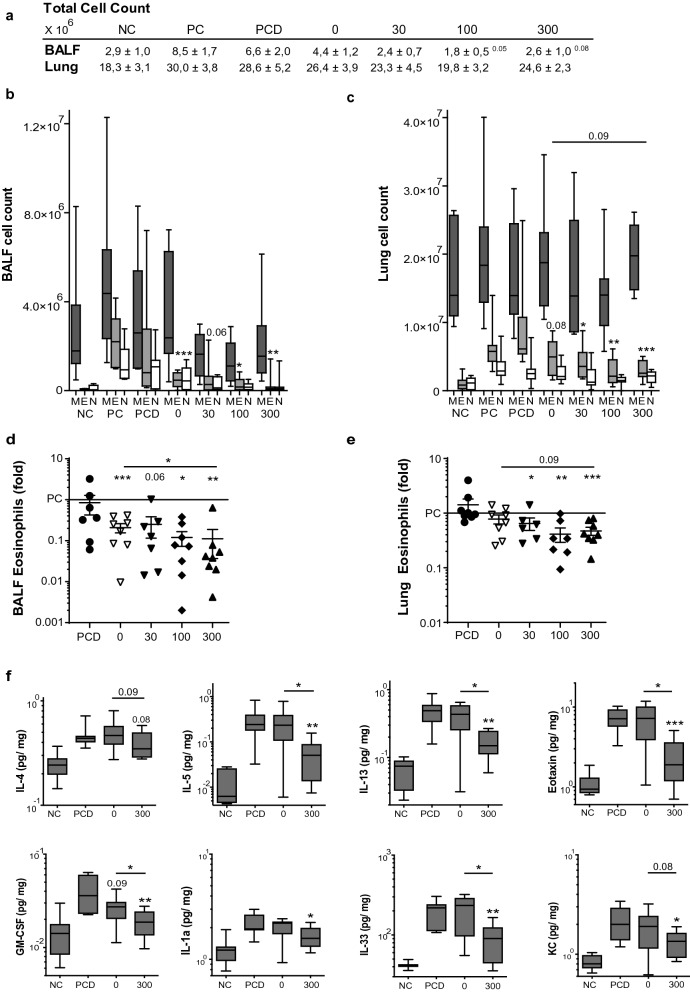
Figure 3.
The eosinophilic and cytokine response after VitD3-GP-SCIT. (a) Total cell counts in bronchoalveolar fluid (BALF) and lung single cell suspensions (Lung). (b) Differential cytospin cell counts in BALF and in (c) Lung. M mononuclear cells, E eosinophils, N Neutrophils. Box-and-whiskers plots (min–max). (d) BALF and lung eosinophils, both plotted as ratio of suppression (absolute EO/average PC EO; mean ± SEM). e Levels of IL-4, IL-5, IL-13, and eotaxin, GM-CSF, IL-1α, IL-33, and KC in pg/mg protein in lung tissue (mean ± SEM, n = 8). NC negative control, PBS challenged; PC positive control, GP challenged; PCD PC with VitD3 in SCIT (300 ng); 0, 30, 100, and 300 groups all contain 300kSQ GP with 0, 30, 100, and 300 ng VitD3 respectively. *P < 0.05, **P < 0.01, ***P < 0.001 compared to PC or PCD: unless otherwise specified.

