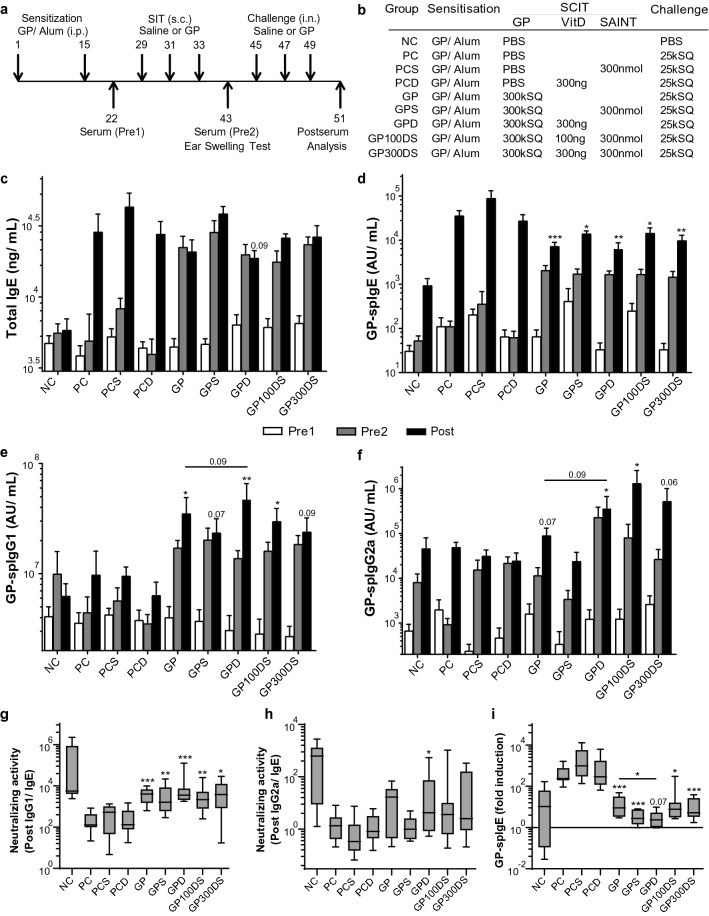
Figure 4.
Overview and immunoglobulin response after VitD3-supplemented GP-SCIT. (a) Experimental protocol. (b) Treatment groups. (c) Serum total IgE (ng/mL) taken before SCIT (white bars, Pre1), after SCIT (grey bars, Pre2), and after challenges (black bars, Post). (d) GP-spIgE (Arbitrary Units (AU)/mL, Pre1-2, Post). (e) GP-spIgG1 (AU/mL, Pre1-2, Post). (f) GP-spIgG2a (AU/mL, Pre1-2, Post). (g) Neutralizing activity plotted as ratio of GP-spIgG1/GP-spIgE in Post sera. (h) Neutralizing activity of GP-spIgG2a/GP-spIgE. (i) Fold induction of GP-spIgE after challenge (Post-sera/Pre2-sera). (c–f) mean ± SEM (n = 8). (g–i) Box-and-whiskers plots (min–max). NC negative control, PBS challenged; PC positive control, GP challenged; PCS PC with 300 nmol SAINT; PCD PC with 300 ng VitD3 in SCIT; GP 300kSQ GP in SCIT; GPS 300kSQ + 300 nmol SAINT; GPD 300kSQ + 300 ng VitD3; GP100DS 300kSQ + 100 ng VitD3 + 300 nmol SAINT; GP300DS 300kSQ + 300 ng VitD3 + 300 nmol SAINT. *P < 0.05, **P < 0.01, ***P < 0.001 compared to their own matching controls, unless otherwise specified.

