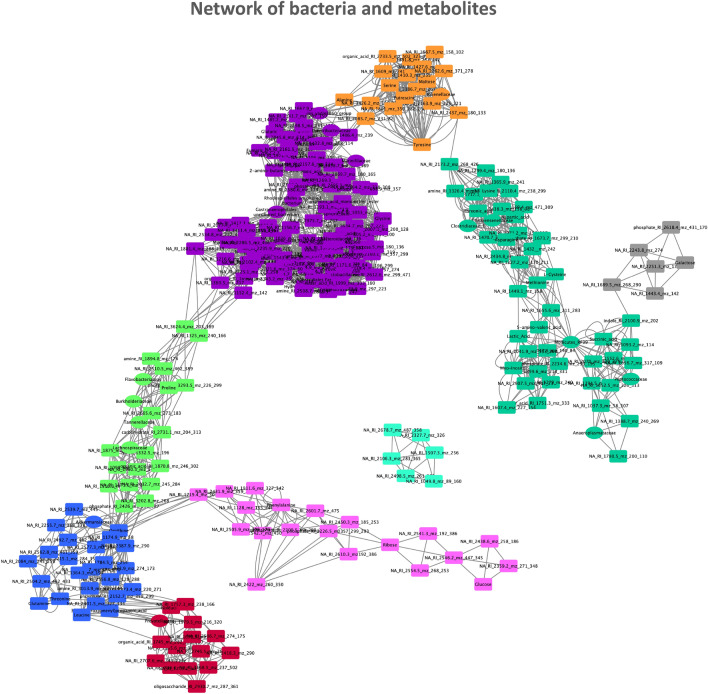
Figure 4.
Correlation network of bacteria with metabolites in the cecum. The correlation network depicts changes in bacterial families composition and metabolites occurrence characteristic to CR. Each node represents one metabolite (ellipse) or a bacterial family-level OUT (V-shape) and each edge represents a statistically significant correlation where the Pearson’s correlation coefficient ≥ 0.8. Girven–Newman algorithm was applied in network clustering analysis where modules (clusters, denoted by different colors) depict association patterns between metabolites and bacteria. The visualization was performed with Cytoscape v3.7.2. (http://www.cytoscape.org/).

