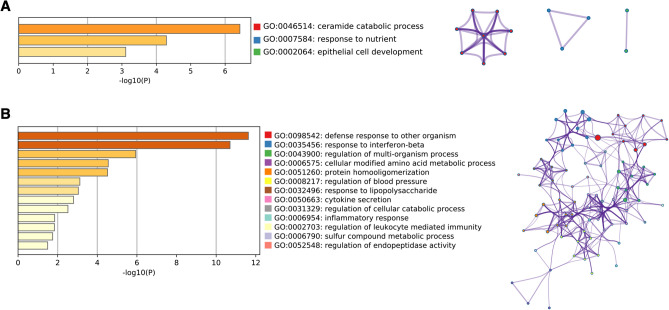
Figure 5.
Biological processes regulated by chronic TNFα treatment. (A) Significantly downregulated GO Biological Processes for continuously expressed proteins in TNFα treated cells. Network plot depicts the relationship between enriched terms. Nodes represent individual enriched terms and are colored based on its cluster ID. Terms with similarity > 0.3 are connected by strings. (B) Significantly upregulated GO Biological Processes for continuously expressed proteins in TNFα treated cells. Network plot depicts the relationship between enriched terms. Nodes represent individual enriched terms and are colored based on its cluster ID. Terms with similarity > 0.3 are connected by strings.

