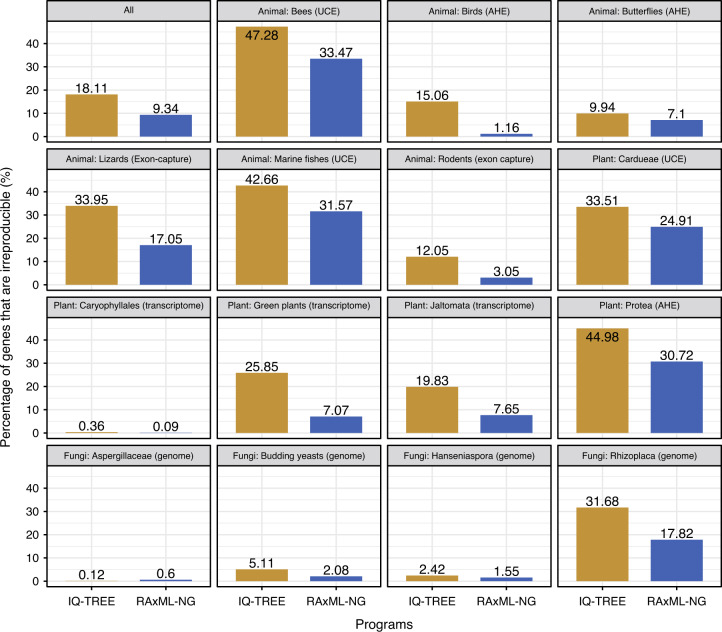
Fig. 2. Considerable numbers of genes in phylogenomic data sets produce irreproducible phylogenies.
Bar plots show the percentages of genes that are irreproducible when using IQ-TREE (in yellow) and RAxML-NG (in blue), respectively. The bar plot at the upper left is based on all 19,414 gene alignments from 15 phylogenomic data sets; it shows that the phylogenies of 3515/19,414 genes (18.11%) and 1813/19,414 genes (9.34%) are irreproducible between two replicates (Run1 and Run2) using IQ-TREE (in yellow) and RAxML-NG (in blue), respectively. The rest of the bar plots show the individual results for each of the 15 phylogenomic data sets. These data sets were constructed using five different but widely accepted gene sampling approaches (shown in parentheses): Ultraconserved Element (UCE) capture, Anchored Hybrid Enriched (AHE) capture, conserved exon capture, transcriptome sequencing, and whole-genome sequencing. All 77,656 analyses (19,414 alignments * 2 replicates * 2ML programs) were run using two threads per node on the Center for High-Throughput Computing (CHTC) at the University of Wisconsin-Madison. Detailed values are given in Supplementary Data 2. All gene alignments, gene trees, and log files, as well as statistics of the results, are available on the figshare repository: 10.6084/m9.figshare.11917770.

