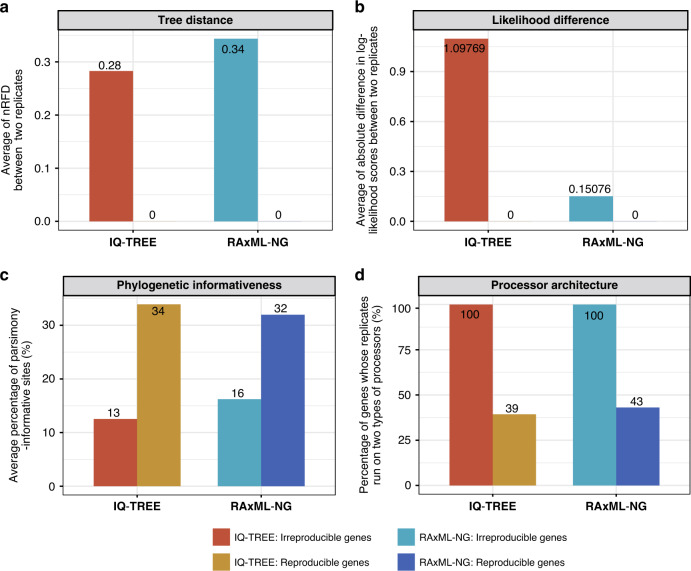
Fig. 3. Key differences between genes that yield irreproducible phylogenies and those that yield reproducible ones.
Using IQ-TREE, 3515/19,414 (18.1%) gene alignments from 15 phylogenomic data sets yielded irreproducible phylogenies between two replicates (red bars), while the remaining 15,899 (81.9%) yielded reproducible phylogenies (yellow bars). Using RAxML-NG, 1813 (9.3%) genes yielded irreproducible phylogenies between two replicates (green bars), while 17,601 (90.7%) yielded reproducible phylogenies (blue bars). For the sets of reproducible and irreproducible genes in IQ-TREE and RAxML-NG analyses, a the normalized Robinson–Foulds tree distance (nRFD) between the gene trees inferred from the Run1 and Run2 replicates, b the absolute difference in log-likelihood values between the Run1 and Run2 replicates, c the percentage of a number of parsimony-informative sites in gene alignment, and d the percentage of Run1 and Run2 replicates executed on two separate 2-CPU nodes with different processor architectures (ML programs can automatically detect the kernel instructions on current processor architecture to best exploit the capabilities of CPU processor). a, b The degree to which the Run1 and Run2 trees of genes that yield irreproducible phylogenies differ in topology (a) and likelihood value (b). Irreproducible genes have a much lower average percentage of parsimony-informative sites (c) and run much more frequently on two different processors (d) than reproducible genes. Detailed values are given in Supplementary Data 2.

