Figure 2.
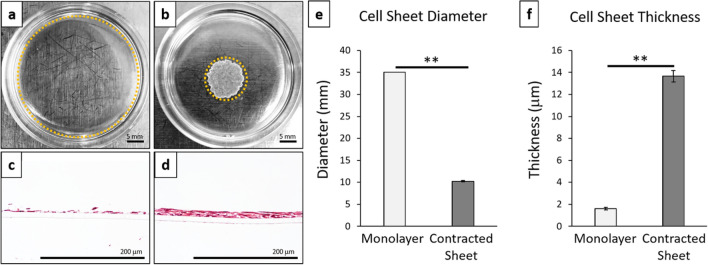
Cell sheet contraction promotes 3D structural rearrangements. Representative macroscopic images of cell culture constructs: (a) 2D monolayer cultures, (b) 3D contracted cell sheets. Cell construct edges marked by dotted orange line. Representative cross-sectional histology of H&E for (c) 2D monolayer culture and (d) 3D contracted cell sheet. Cell construct (e) diameter and (f) thickness for monolayer cultures compared to contracted cell sheets. Error bars represent means ± SD (n = 4) (**p < 0.01). Microscopic photos acquired with AmScope Software (v4.8.15934, https://www.amscope.com/software-download) (c,d).

