Figure 3.
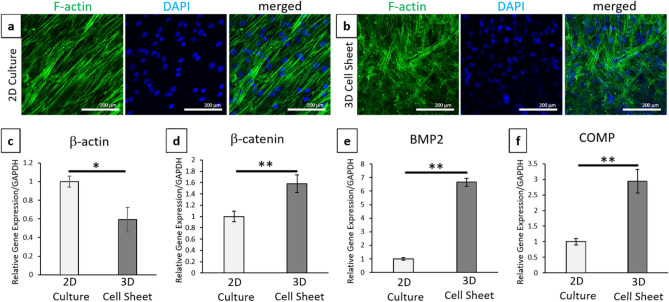
Cell sheet contraction promotes cytoskeletal rearrangements and pro-chondrogenic signaling compared to 2D cell culture. Representative confocal images of full dish (top–down) (a) 2D cultures and (b) 3D contracted sheets before chondrogenic induction at day-0 with phalloidin/F-actin (green) staining for cytoskeleton and DAPI (blue) nuclear staining. Quantitative real-time PCR gene expression for (c) cytoskeletal structure marker β-actin, (d) cell–cell marker β-catenin, and chondrogenic ECM markers (d) BMP2 and (f) COMP. All gene expression normalized to GAPDH and compared to the 2D cell culture 0-day control sample. Error bars represent means ± SD (n = 4) (*p < 0.05, **p < 0.01). Microscopic photos acquired with NIS Elements AR Software (v.4.30.01, https://www.nikon.com/products/microscope-solutions/support/download/software/imgsfw/nis-ar_v43001du164.htm) (a,b).

