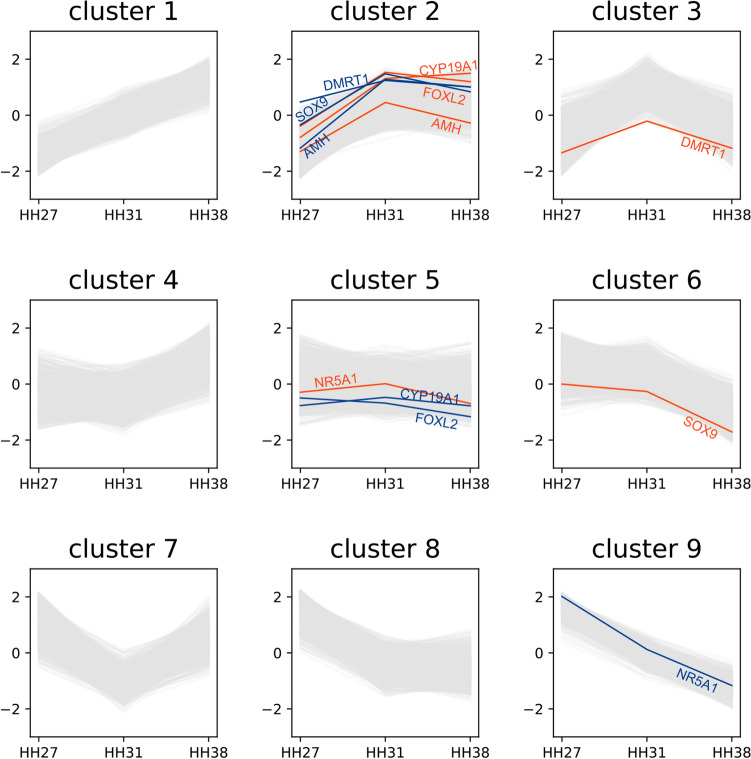
Figure 2.
Expression patterns of nine clusters during gonadal sex differentiation. Between HH27 and HH31, gene expression levels increased in clusters 1, 2 and 3, remained constant in clusters 4, 5 and 6, and decreased in clusters 7, 8 and 9. Similarly, between HH31 and HH38, gene expression levels increased in clusters 1, 4 and 7, remained the same in clusters 2, 5 and 8, and decreased in clusters 3, 6 and 9. Blue and orange lines indicate genes related to gonadal differentiation in males (ZZ) and females (ZW), respectively.

