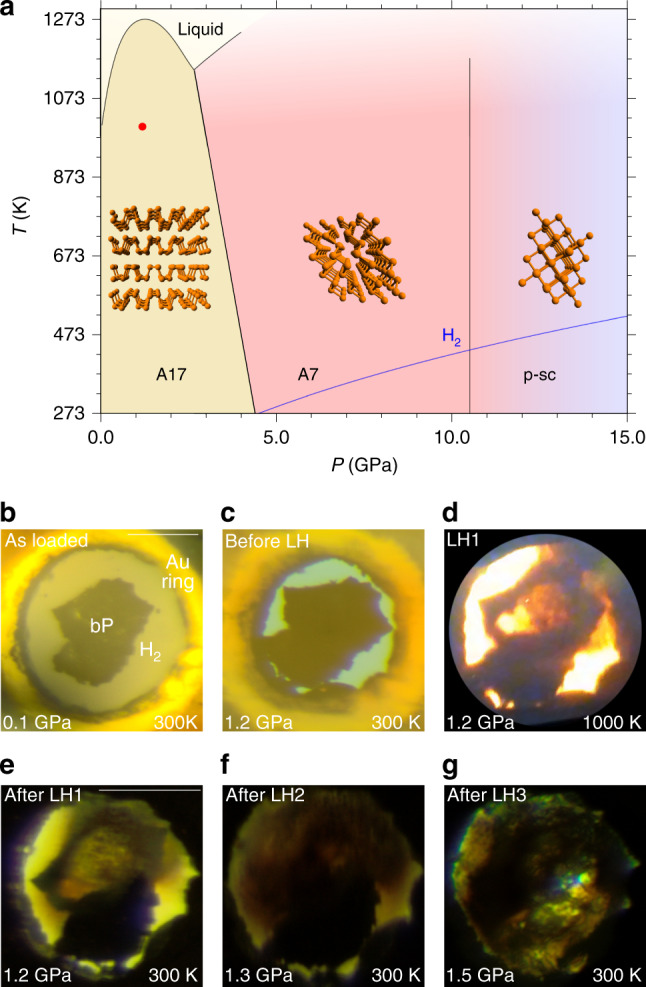
Fig. 1. Phase diagram and reactivity of P and H2 at high pressure and high temperature.

a Phase diagram of phosphorus (black lines), showing the stability regions of the orthorhombic (A17, Pblack), rhombohedral (A7) and pseudo simple-cubic (p-sc) structures4,5. The melting line of H273 (blue line) and laser heating conditions (red point at P = 1.2 GPa, T ≈ 1000 K) are also displayed. b–g Microphotographs showing the sample aspect after loading (b), before, during and after LH1 (c–e), after LH2 (f), and after LH3 (g) at pressure ranging between 1.2 and 1.5 GPa (LH1, LH2, and LH3, respectively, indicate the first, the second and the third laser heating). The scale bars in the top right corner of b, e correspond to 100 μm.
