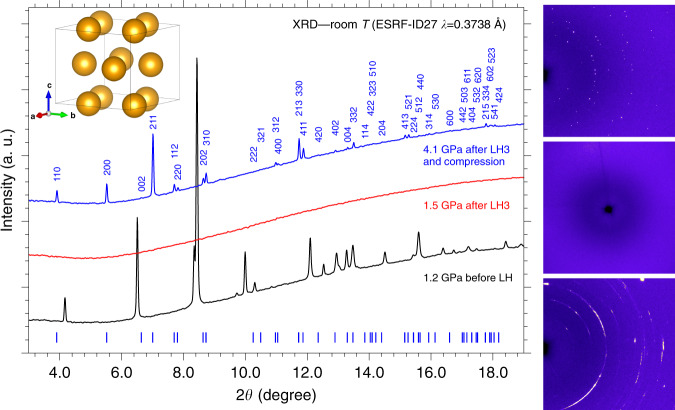
Fig. 2. X-ray diffraction.
Integrated panoramic XRD patterns and corresponding detector images of the sample, acquired at room T before laser heating (LH) at 1.2 GPa (black trace, bottom image), after the third laser heating (LH3) at 1.5 GPa (red trace, middle image), and after compression at 4.1 GPa (blue trace, top image). The blue ticks and labels respectively refer to the refined peak positions of the crystalline product at this pressure (Supplementary Note 1) and to the corresponding h,k,l indexing. The tetragonal I4cm structure of P atoms as obtained from single-crystal data at 5.5 GPa is also shown in the top left corner of the Figure (see the “X-Ray Diffraction” section).

