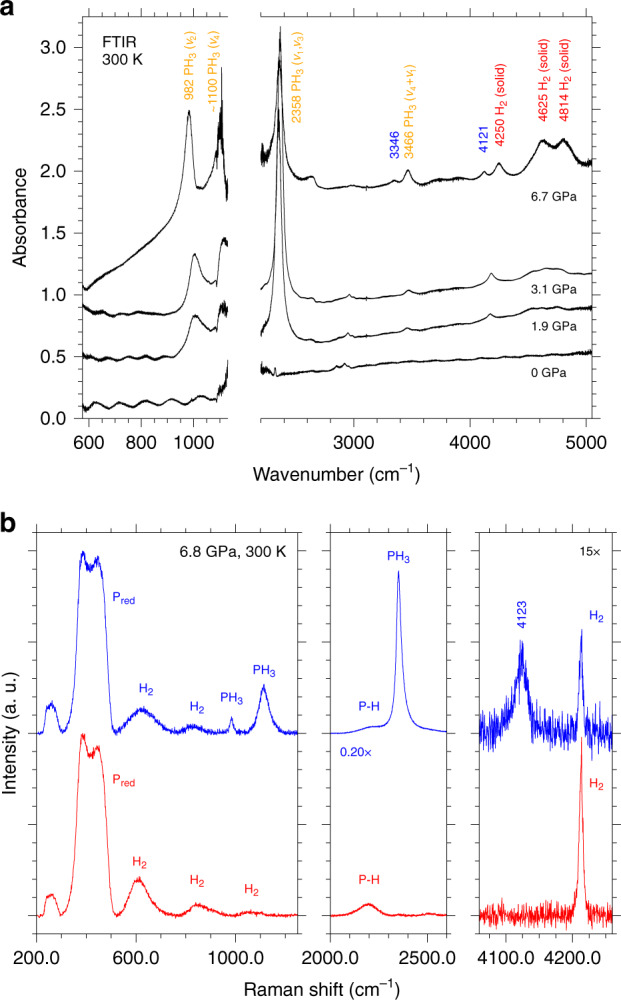
Fig. 3. FTIR and Raman spectroscopy.

a Room T FTIR absorption spectra of the sample acquired at 6.7 GPa after LH3 and at different pressure values during decompression to ambient conditions. The two bands at 3346 and 4121 cm−1 labeled in blue disappear on releasing pressure to 3.1 GPa. The spectra have been vertically translated for clarity and the values on the absorbance scale are intended for relative comparison. The break on the wavenumber axis excludes the spectral range corresponding to the Ia diamond saturating absorptions, which partially covers the ν4 absorption of PH3. The absorption features at ~2640 cm−1 (6.7 GPa) and ~2900 cm−1 (appearing on releasing pressure to 3.1 GPa) are assigned respectively to the diamond from the ambient pressure reference and to traces of oil on the optics of the interferometer. b Significant spectral regions of type-1 (red, lower trace) and type-2 (blue, upper trace) Raman spectra acquired on different selected spots of the mapping grid across the sample at 6.8 GPa and room T after LH. With respect to type-1 spectrum the type-2 one clearly shows the simultaneous presence of PH3 and of the extra band at 4123 cm−1 in the H2 stretching region at lower frequency compared to pure H2.
