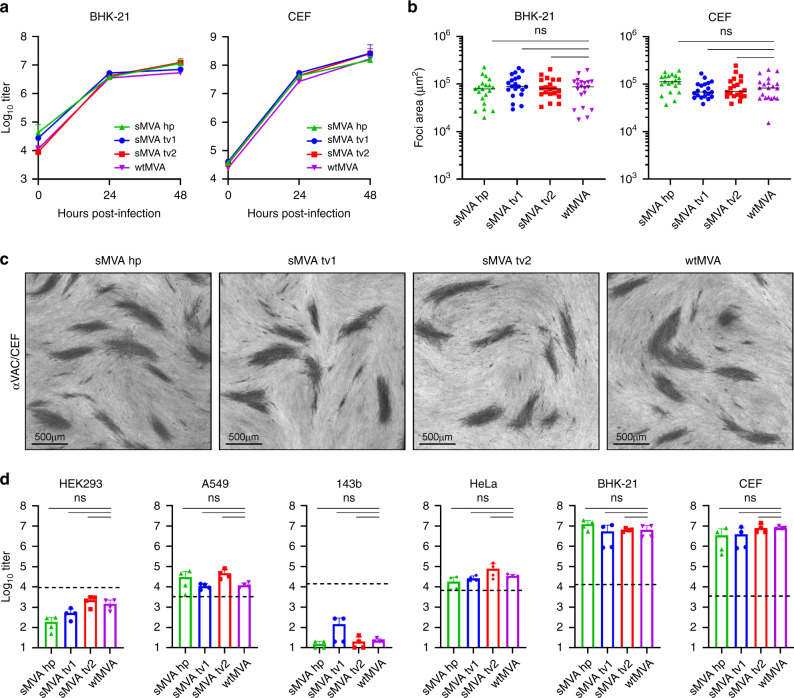
Fig. 2. sMVA replication properties.
The replication properties of sMVA, derived either with FPV HP1.441 (sMVA hp) or with FPV TROVAC from two independent sMVA virus reconstitutions (sMVA tv1 and sMVA tv2), were compared with that of wtMVA. a Replication kinetics. BHK or CEF cells were infected in triplicates (n = 3) for each time point at 0.02 multiplicity of infection (MOI) with sMVA or wtMVA and viral titers of the inoculum and each triplicate infection were determined at 24 and 48 h post infection on CEF. Mixed-effects model with the Geisser-Greenhouse correction followed by Tukey’s multiple comparison test were applied; at 24 and 48 h post-infection differences between groups were not significant (p > 0.05). b, c Viral foci size analysis. BHK or CEF cell monolayers were infected at 0.002 MOI with sMVA or wtMVA and areas of viral foci (n = 20) were determined at 24 h post infection following immunostaining with anti-Vaccinia polyclonal antibody (αVAC). Panel c provides examples of sMVA and wtMVA viral foci following immunostaining of infected CEF. d Host cell range analysis. Various human cell lines (HEK293, A549, 143b, and HeLa), CEF or BHK cells were infected in duplicates (n = 2) at 0.01 MOI with sMVA or wtMVA and virus titers of each duplicate infection were determined in duplicates (n = 4 in total) at 48 h post infection on CEF. Dotted lines indicate the calculated virus titer of the inoculum based on 0.01 MOI. Differences between groups in b and d were calculated using one-way ANOVA followed by Tukey’s (b) or Dunnett’s (d) multiple comparison tests; ns = not significant (p > 0.05). Data in a and d are presented as mean values + SD. Lines in b represent median values. Source data are provided as a Source Data file.

